Coca Cola 2015 Annual Report Download - page 50
Download and view the complete annual report
Please find page 50 of the 2015 Coca Cola annual report below. You can navigate through the pages in the report by either clicking on the pages listed below, or by using the keyword search tool below to find specific information within the annual report.-
 1
1 -
2
-
3
-
4
-
5
-
6
-
7
-
8
-
9
-
10
-
11
-
12
-
13
-
14
-
15
-
16
-
17
-
18
-
19
-
20
-
21
-
22
-
23
-
24
-
25
-
26
-
27
-
28
-
29
-
30
-
31
-
32
-
33
-
34
-
35
-
36
-
37
-
38
-
39
-
 40
40 -
 41
41 -
 42
42 -
 43
43 -
 44
44 -
 45
45 -
 46
46 -
 47
47 -
 48
48 -
 49
49 -
 50
50 -
 51
51 -
 52
52 -
 53
53 -
 54
54 -
 55
55 -
 56
56 -
 57
57 -
 58
58 -
 59
59 -
 60
60 -
61
-
62
-
63
-
64
-
65
-
66
-
67
-
68
-
69
-
70
-
71
-
72
-
73
-
74
-
75
-
76
-
77
-
78
-
79
-
80
-
81
-
82
-
83
-
84
-
85
-
86
-
87
-
88
-
89
-
90
-
91
-
92
-
93
-
94
-
95
-
96
-
97
-
98
-
99
-
100
-
101
-
102
-
103
-
104
-
105
-
106
-
107
-
108
-
109
-
110
-
111
-
112
-
113
-
114
-
115
-
116
-
117
-
118
-
119
-
120
-
121
-
122
-
123
-
124
-
125
-
126
-
127
-
128
-
129
-
130
-
131
-
132
-
133
-
134
-
135
-
136
-
137
-
138
-
139
-
140
-
141
-
142
-
143
-
144
-
145
-
146
-
147
-
148
-
149
-
150
-
151
-
152
-
153
-
154
-
155
-
156
-
157
-
158
-
159
-
160
-
161
-
162
-
163
-
164
-
165
-
166
-
167
-
168
-
169
-
170
-
171
-
172
-
173
-
174
-
175
-
176
-
177
-
178
-
179
-
180
-
181
-
182
-
183
-
184
-
185
-
186
-
187
-
188
-
189
-
190
-
191
-
192
-
193
-
194
-
195
-
196
-
197
-
198
-
199
-
200
-
201
-
202
-
203
-
204
-
205
-
206
-
207
-
208
-
209
-
210
-
211
-
212
-
213
-
214
-
215
-
216
-
217
-
218
-
219
-
220
 |
 |

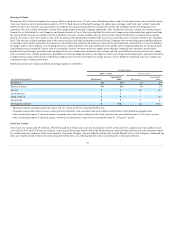
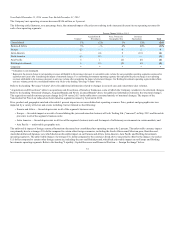
Year Ended December 31, 2015 versus Year Ended December 31, 2014
Unit case volume in Eurasia and Africa increased 3 percent, which consisted of 2 percent growth in sparkling beverages and 6 percent growth in still
beverages. The group's sparkling beverage growth included 3 percent growth in Trademark Coca-Cola, and the growth in still beverages was led by packaged
water and juices and juice drinks. Eurasia and Africa benefited from unit case volume growth of 8 percent, 6 percent and 2 percent in the Central, East & West
Africa, Southern Africa, and Middle East & North Africa business units, respectively, partially offset by a decline of 4 percent in the Russia, Ukraine &
Belarus business unit.
In Europe, unit case volume grew 2 percent, reflecting 7 percent growth in still beverages and 1 percent growth in sparkling beverages. The growth in still
beverages was driven by the group's performance in packaged water, teas, sports drinks and the expansion of the innocent brand. The group's sparkling
beverage growth included 9 percent growth in Coca-Cola Zero and 4 percent growth in Trademark Fanta.
Unit case volume in Latin America grew 1 percent as a result of growth in still beverages of 4 percent and even sparkling beverage volume. The growth in
still beverages was led by growth in packaged water, juices and juice drinks and sports drinks. The Latin Center and South Latin business units reported unit
case volume growth of 4 percent and 3 percent, respectively. The Mexico business unit reported unit case volume growth of 3 percent, reflecting growth in
Trademark Coca-Cola of 3 percent. The growth in the Latin Center, South Latin and Mexico business units was partially offset by a unit case volume decline
of 4 percent in the Brazil business unit.
In North America, unit case volume grew 1 percent. This increase reflects 5 percent growth in still beverage volume and even sparkling beverage volume. The
still beverage growth in the group was led by 8 percent growth in packaged water and 6 percent growth in teas. After considering the impact of the acquired
volume resulting from the Monster Transaction, North America unit case volume growth remained 1 percent.
Unit case volume in Asia Pacific increased 4 percent, which consisted of 4 percent growth in both sparkling and still beverage volume. The sparkling
beverage volume growth was led by a 5 percent increase in Trademark Coca-Cola, a 4 percent increase in Trademark Sprite and a 6 percent increase in
Trademark Fanta. Still beverage volume growth was led by increases in packaged water and teas of 12 percent and 6 percent, respectively. China's unit case
volume grew 5 percent during the year, led by 12 percent growth in Trademark Coca-Cola and 3 percent growth in Trademark Sprite. India reported unit case
volume growth of 4 percent and Japan reported even volume during the year.
Unit case volume for Bottling Investments increased 8 percent. This increase primarily reflects the growth in China and India. In addition, unit case volume
in Germany grew 2 percent. The Company's consolidated bottling operations accounted for 34 percent, 69 percent, and 100 percent of the unit case volume
in China, India and Germany, respectively.
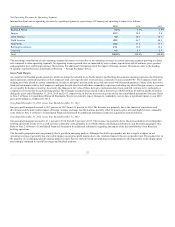
Year Ended December 31, 2014 versus Year Ended December 31, 2013
Unit case volume in Eurasia and Africa increased 4 percent, which consisted of 3 percent growth in sparkling beverages and 8 percent growth in still
beverages. The group's sparkling beverage growth included 2 percent growth in Trademark Coca-Cola, 3 percent growth in Trademark Sprite, and 2 percent
growth in Trademark Fanta. Growth in the group's still beverages was led by packaged water, juices and juice drinks and teas. The group's growth reflects a
continued focus on improved marketplace execution and providing greater consumer choice in package and price options. Eurasia and Africa benefited from
unit case volume growth of 7 percent and 6 percent in the Middle East & North Africa and Central, East & West Africa business units, respectively. This
growth was partially offset by a decline in unit case volume of 1 percent in the Russia, Ukraine & Belarus business unit.
In Europe, unit case volume declined 2 percent as a result of a decline in sparkling beverages of 3 percent, partially offset by growth in still beverages of 1
percent. The decline in sparkling beverages reflects the softness in the macroeconomic environment and continuing competitive pressures in the market. The
growth in still beverages was led by growth in juices and juice drinks.
Unit case volume in Latin America increased 1 percent reflecting growth in still beverages of 6 percent and even sparkling beverage volume. The growth in
still beverages was led by packaged water, value-added dairy and sports drinks. Latin America benefited from unit case volume growth of 6 percent and 2
percent in the Latin Center and Brazil business units, respectively, partially offset by a volume decline of 1 percent in the Mexico business unit. The decline
in Mexico was primarily due to the impact of a new excise tax that went into effect on January 1, 2014.
In North America, unit case volume was even, reflecting 1 percent growth in still beverages offset by a decline of 1 percent in sparkling beverages. The still
beverage growth was led by 8 percent growth in packaged water and 4 percent growth in teas.
48