Coca Cola 2015 Annual Report Download - page 44
Download and view the complete annual report
Please find page 44 of the 2015 Coca Cola annual report below. You can navigate through the pages in the report by either clicking on the pages listed below, or by using the keyword search tool below to find specific information within the annual report.-
 1
1 -
2
-
3
-
4
-
5
-
6
-
7
-
8
-
9
-
10
-
11
-
12
-
13
-
14
-
15
-
16
-
17
-
18
-
19
-
20
-
21
-
22
-
23
-
24
-
25
-
26
-
27
-
28
-
29
-
30
-
31
-
32
-
33
-
 34
34 -
 35
35 -
 36
36 -
 37
37 -
 38
38 -
 39
39 -
 40
40 -
 41
41 -
 42
42 -
 43
43 -
 44
44 -
 45
45 -
 46
46 -
 47
47 -
 48
48 -
 49
49 -
 50
50 -
 51
51 -
 52
52 -
 53
53 -
 54
54 -
55
-
56
-
57
-
58
-
59
-
60
-
61
-
62
-
63
-
64
-
65
-
66
-
67
-
68
-
69
-
70
-
71
-
72
-
73
-
74
-
75
-
76
-
77
-
78
-
79
-
80
-
81
-
82
-
83
-
84
-
85
-
86
-
87
-
88
-
89
-
90
-
91
-
92
-
93
-
94
-
95
-
96
-
97
-
98
-
99
-
100
-
101
-
102
-
103
-
104
-
105
-
106
-
107
-
108
-
109
-
110
-
111
-
112
-
113
-
114
-
115
-
116
-
117
-
118
-
119
-
120
-
121
-
122
-
123
-
124
-
125
-
126
-
127
-
128
-
129
-
130
-
131
-
132
-
133
-
134
-
135
-
136
-
137
-
138
-
139
-
140
-
141
-
142
-
143
-
144
-
145
-
146
-
147
-
148
-
149
-
150
-
151
-
152
-
153
-
154
-
155
-
156
-
157
-
158
-
159
-
160
-
161
-
162
-
163
-
164
-
165
-
166
-
167
-
168
-
169
-
170
-
171
-
172
-
173
-
174
-
175
-
176
-
177
-
178
-
179
-
180
-
181
-
182
-
183
-
184
-
185
-
186
-
187
-
188
-
189
-
190
-
191
-
192
-
193
-
194
-
195
-
196
-
197
-
198
-
199
-
200
-
201
-
202
-
203
-
204
-
205
-
206
-
207
-
208
-
209
-
210
-
211
-
212
-
213
-
214
-
215
-
216
-
217
-
218
-
219
-
220
 |
 |

this trademark do not support the current near-term financial projections, or if macroeconomic conditions change causing the cost of capital and/or discount
rate to increase without an offsetting increase in the operating results, it is likely that we would be required to recognize an additional impairment charge
related to this trademark.
During 2015, the Company also recorded a charge of $55 million related to the impairment of a Venezuelan trademark. The Venezuelan trademark
impairment was due to the Company's revised expectations regarding the convertibility of the local currency.
These charges were recorded in our Corporate operating segment in the line item other operating charges in our consolidated statement of income and were
determined by comparing the fair value of the trademarks, derived using discounted cash flow analyses, to the respective carrying value. Management will
continue to monitor the fair value of our intangible assets in future periods.
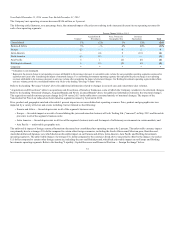
The Company did not record any significant impairment charges related to intangible assets during the year ended December 31, 2014. During 2013, the
Company recorded charges of $195 million related to certain intangible assets. These charges included $113 million related to the impairment of trademarks
recorded in our Bottling Investments and Asia Pacific operating segments. These impairments were primarily due to a strategic decision to phase out certain
local-market brands, which resulted in a change in the expected useful life of the intangible assets, and were determined by comparing the fair value of the
trademarks, derived using discounted cash flow analyses, to the current carrying value. Additionally, the remaining charge of $82 million related to goodwill
recorded in our Bottling Investments operating segment. This charge was primarily the result of management's revised outlook on market conditions and
volume performance. The total impairment charges of $195 million were recorded in our Corporate operating segment in the line item other operating
charges in our consolidated statements of income.
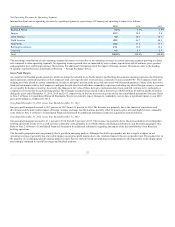
Pension Plan Valuations
Our Company sponsors and/or contributes to pension and postretirement health care and life insurance benefit plans covering substantially all U.S.
employees. We also sponsor nonqualified, unfunded defined benefit pension plans for certain associates and participate in multi-employer pension plans in
the United States. In addition, our Company and its subsidiaries have various pension plans and other forms of postretirement arrangements outside the
United States.
Management is required to make certain critical estimates related to actuarial assumptions used to determine our pension expense and obligations. We
believe the most critical assumptions are related to (1) the discount rate used to determine the present value of the liabilities and (2) the expected long-term
rate of return on plan assets. All of our actuarial assumptions are reviewed annually. Changes in these assumptions could have a material impact on the
measurement of our pension expense and obligations.
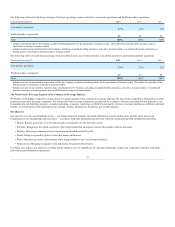
At each measurement date, we determine the discount rate primarily by reference to rates of high-quality, long-term corporate bonds that mature in a pattern
similar to the future payments we anticipate making under the plans. As of December 31, 2015 and 2014, the weighted-average discount rate used to compute
our pension obligations was 4.25 percent and 3.75 percent, respectively.
During the years ended December 31, 2015, 2014, and 2013, for plans using the yield curve approach, the Company measured the related service and interest
components of net periodic benefit cost for pension and other postretirement benefit plans utilizing the single weighted-average discount rate derived from
the yield curve. Effective January 1, 2016, the Company changed the method used to calculate the service and interest components and will measure these
costs by applying the specific spot rates along the yield curve to the plans' projected cash flows. The Company believes the new approach provides a more
precise measurement of service and interest costs by improving the correlation between projected cash flows and the corresponding spot yield curve rates.
The change does not affect the measurement of the Company's pension and other postretirement benefit obligations for those plans and is accounted for as a
change in accounting estimate, which is applied prospectively. In 2016, we expect the change in estimate to reduce pension and other postretirement net
periodic benefit plan costs by $73 million.
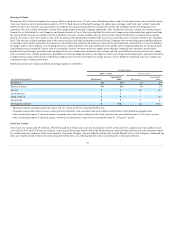
The expected long-term rate of return on plan assets is based upon the long-term outlook of our investment strategy as well as our historical returns and
volatilities for each asset class. We also review current levels of interest rates and inflation to assess the reasonableness of our long-term rates. Our pension
plan investment objective is to ensure all of our plans have sufficient funds to meet their benefit obligations when they become due. As a result, the Company
periodically revises asset allocations, where appropriate, to improve returns and manage risk. The weighted-average expected long-term rate of return used to
calculate our pension expense was 8.25 percent in 2015 and 2014.
42