Coca Cola 2015 Annual Report Download - page 103
Download and view the complete annual report
Please find page 103 of the 2015 Coca Cola annual report below. You can navigate through the pages in the report by either clicking on the pages listed below, or by using the keyword search tool below to find specific information within the annual report.-
 1
1 -
2
-
3
-
4
-
5
-
6
-
7
-
8
-
9
-
10
-
11
-
12
-
13
-
14
-
15
-
16
-
17
-
18
-
19
-
20
-
21
-
22
-
23
-
24
-
25
-
26
-
27
-
28
-
29
-
30
-
31
-
32
-
33
-
34
-
35
-
36
-
37
-
38
-
39
-
40
-
41
-
42
-
43
-
44
-
45
-
46
-
47
-
48
-
49
-
50
-
51
-
52
-
53
-
54
-
55
-
56
-
57
-
58
-
59
-
60
-
61
-
62
-
63
-
64
-
65
-
66
-
67
-
68
-
69
-
70
-
71
-
72
-
73
-
74
-
75
-
76
-
77
-
78
-
79
-
80
-
81
-
82
-
83
-
84
-
85
-
86
-
87
-
88
-
89
-
90
-
91
-
92
-
 93
93 -
 94
94 -
 95
95 -
 96
96 -
 97
97 -
 98
98 -
 99
99 -
 100
100 -
 101
101 -
 102
102 -
 103
103 -
 104
104 -
 105
105 -
 106
106 -
 107
107 -
 108
108 -
 109
109 -
 110
110 -
 111
111 -
 112
112 -
 113
113 -
114
-
115
-
116
-
117
-
118
-
119
-
120
-
121
-
122
-
123
-
124
-
125
-
126
-
127
-
128
-
129
-
130
-
131
-
132
-
133
-
134
-
135
-
136
-
137
-
138
-
139
-
140
-
141
-
142
-
143
-
144
-
145
-
146
-
147
-
148
-
149
-
150
-
151
-
152
-
153
-
154
-
155
-
156
-
157
-
158
-
159
-
160
-
161
-
162
-
163
-
164
-
165
-
166
-
167
-
168
-
169
-
170
-
171
-
172
-
173
-
174
-
175
-
176
-
177
-
178
-
179
-
180
-
181
-
182
-
183
-
184
-
185
-
186
-
187
-
188
-
189
-
190
-
191
-
192
-
193
-
194
-
195
-
196
-
197
-
198
-
199
-
200
-
201
-
202
-
203
-
204
-
205
-
206
-
207
-
208
-
209
-
210
-
211
-
212
-
213
-
214
-
215
-
216
-
217
-
218
-
219
-
220
 |
 |

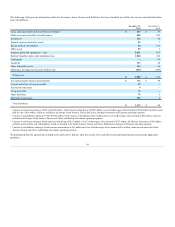
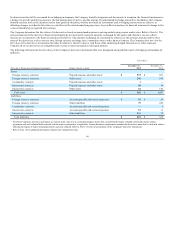
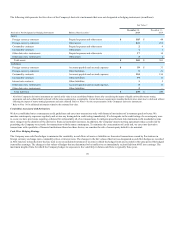
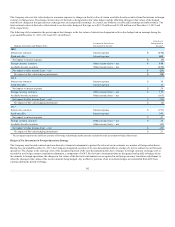
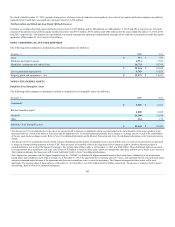
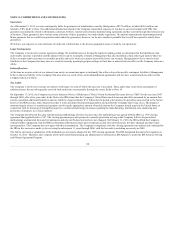
The following table presents the pretax impact that changes in the fair values of derivatives designated as cash flow hedges had on AOCI and earnings during
the years ended December 31, 2015, 2014 and 2013 (in millions):
Gain (Loss)
Recognized
in Other
Comprehensive
Income ("OCI")
Location of Gain (Loss)
Recognized in Income1
Gain (Loss)
Reclassified from
AOCI into Income
(Effective Portion)
Gain (Loss)
Recognized in
Income
(Ineffective Portion
and
Amount Excluded
from
Effectiveness
Testing)
Foreign currency contracts
Net operating revenues
Foreign currency contracts
Cost of goods sold
Foreign currency contracts
Interest expense
Foreign currency contracts
Other income (loss) — net
Interest rate contracts
Interest expense
Commodity contracts
Cost of goods sold
Total
2014
Foreign currency contracts $ 973
Net operating revenues
$ 121
$ — 2
Foreign currency contracts 50
Cost of goods sold
34
—2
Foreign currency contracts (218)
Other income (loss) — net
(108)
—
Interest rate contracts (180)
Interest expense
—
—
Commodity contracts —
Cost of goods sold
3
—
Total $ 625
$ 50
$ —
2013
Foreign currency contracts $ 218
Net operating revenues
$ 149
$ 1
Foreign currency contracts 52
Cost of goods sold
32
—2
Interest rate contracts 169
Interest expense
(12)
(3)
Commodity contracts 2
Cost of goods sold
(2)
—
Total $ 441
$ 167
$ (2)
1 The Company records gains and losses reclassified from AOCI into income for the effective portion and ineffective portion, if any, to the same line items in our consolidated
statements of income.
2 Includes a de minimis amount of ineffectiveness in the hedging relationship.
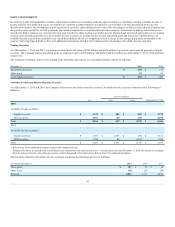
As of December 31, 2015, the Company estimates that it will reclassify into earnings during the next 12 months gains of $697 million from the pretax amount
recorded in AOCI as the anticipated cash flows occur.
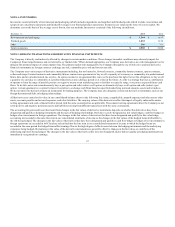
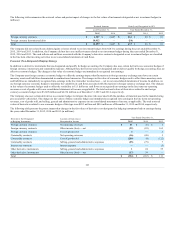
Fair Value Hedging Strategy
The Company uses interest rate swap agreements designated as fair value hedges to minimize exposure to changes in the fair value of fixed-rate debt that
results from fluctuations in benchmark interest rates. The Company also uses cross-currency interest rate swaps to hedge the changes in the fair value of
foreign currency denominated debt relating to changes in foreign currency exchange rates and benchmark interest rates. The changes in fair values of
derivatives designated as fair value hedges and the offsetting changes in fair values of the hedged items are recognized in earnings. The ineffective portions
of these hedges are immediately recognized into earnings. As of December 31, 2015, such adjustments had cumulatively decreased the carrying value of our
long-term debt by $86 million. When a derivative is no longer designated as a fair value hedge for any reason, including termination and maturity, the
remaining unamortized difference between the carrying value of the hedged item at that time and the face value of the hedged item is amortized to earnings
over the remaining life of the hedged item, or immediately if the hedged item has matured. The total notional values of derivatives that related to our fair
value hedges of this type were $7,963 million and $6,600 million as of December 31, 2015 and 2014, respectively.
101