Coca Cola 2015 Annual Report Download - page 137
Download and view the complete annual report
Please find page 137 of the 2015 Coca Cola annual report below. You can navigate through the pages in the report by either clicking on the pages listed below, or by using the keyword search tool below to find specific information within the annual report.-
 1
1 -
2
-
3
-
4
-
5
-
6
-
7
-
8
-
9
-
10
-
11
-
12
-
13
-
14
-
15
-
16
-
17
-
18
-
19
-
20
-
21
-
22
-
23
-
24
-
25
-
26
-
27
-
28
-
29
-
30
-
31
-
32
-
33
-
34
-
35
-
36
-
37
-
38
-
39
-
40
-
41
-
42
-
43
-
44
-
45
-
46
-
47
-
48
-
49
-
50
-
51
-
52
-
53
-
54
-
55
-
56
-
57
-
58
-
59
-
60
-
61
-
62
-
63
-
64
-
65
-
66
-
67
-
68
-
69
-
70
-
71
-
72
-
73
-
74
-
75
-
76
-
77
-
78
-
79
-
80
-
81
-
82
-
83
-
84
-
85
-
86
-
87
-
88
-
89
-
90
-
91
-
92
-
93
-
94
-
95
-
96
-
97
-
98
-
99
-
100
-
101
-
102
-
103
-
104
-
105
-
106
-
107
-
108
-
109
-
110
-
111
-
112
-
113
-
114
-
115
-
116
-
117
-
118
-
119
-
120
-
121
-
122
-
123
-
124
-
125
-
126
-
 127
127 -
 128
128 -
 129
129 -
 130
130 -
 131
131 -
 132
132 -
 133
133 -
 134
134 -
 135
135 -
 136
136 -
 137
137 -
 138
138 -
 139
139 -
 140
140 -
 141
141 -
 142
142 -
 143
143 -
 144
144 -
 145
145 -
 146
146 -
 147
147 -
148
-
149
-
150
-
151
-
152
-
153
-
154
-
155
-
156
-
157
-
158
-
159
-
160
-
161
-
162
-
163
-
164
-
165
-
166
-
167
-
168
-
169
-
170
-
171
-
172
-
173
-
174
-
175
-
176
-
177
-
178
-
179
-
180
-
181
-
182
-
183
-
184
-
185
-
186
-
187
-
188
-
189
-
190
-
191
-
192
-
193
-
194
-
195
-
196
-
197
-
198
-
199
-
200
-
201
-
202
-
203
-
204
-
205
-
206
-
207
-
208
-
209
-
210
-
211
-
212
-
213
-
214
-
215
-
216
-
217
-
218
-
219
-
220
 |
 |

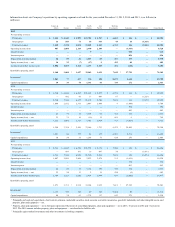
In 2013, the Company recorded a gain of $615 million due to the deconsolidation of our Brazilian bottling operations as a result of their combination with
an independent bottling partner. Subsequent to this transaction, the Company accounts for our investment in the newly combined Brazilian bottling
operations under the equity method of accounting. The owners of the majority interest received the option to acquire from us up to 24 percent of the new
entity's outstanding shares at any time for a period of six years beginning December 31, 2013. In December 2014, the Company received notification that the
owners of the majority interest had exercised their option to acquire from us a 10 percent interest in the entity's outstanding shares. During the year ended
December 31, 2014, we recorded an estimated loss of $32 million as a result of the exercise price being lower than our carrying value. The transaction closed
in January 2015, and the Company recorded an additional loss of $6 million during the year ended December 31, 2015, based on the final option price. Refer
to Note 2 for additional information on this transaction. Refer to Note 19 for the impact these items had on our operating segments.
Effective July 1, 2013, four of the Company's Japanese bottling partners merged as Coca-Cola East Japan Bottling Company, Ltd. ("CCEJ"), a publicly traded
entity, through a share exchange. The terms of the agreement included the issuance of new shares of one of the publicly traded bottlers in exchange for 100
percent of the outstanding shares of the remaining three bottlers according to an agreed-upon share exchange ratio. As a result, the Company recorded a net
charge of $114 million for those investments in which the Company's carrying value was greater than the fair value of the shares received. Refer to Note 19
for the impact this loss had on our operating segments.
In 2013, the Company recorded a charge of $140 million due to the Venezuelan government announcing a currency devaluation. As a result of this
devaluation, the Company remeasured the net monetary assets related to its operations in Venezuela. Refer to Note 19 for the impact this charge had on our
operating segments. The Company also recognized a gain of $139 million due to Coca-Cola FEMSA issuing additional shares of its own stock at a per share
amount greater than the carrying value of the Company's per share investment. Accordingly, the Company is required to treat this type of transaction as if the
Company sold a proportionate share of its investment in Coca-Cola FEMSA. Refer to Note 16 for additional information on the measurement of the gain and
Note 19 for the impact this gain had on our operating segments.
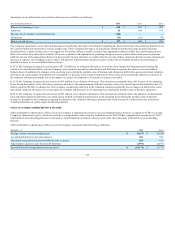
Productivity and Reinvestment
In February 2012, the Company announced a four-year productivity and reinvestment program designed to further enable our efforts to strengthen our brands
and reinvest our resources to drive long-term profitable growth. This program is focused on the following initiatives: global supply chain optimization;
global marketing and innovation effectiveness; operating expense leverage and operational excellence; data and information technology systems
standardization; and the integration of Old CCE's North American bottling operations.
In February 2014, the Company announced the expansion of our productivity and reinvestment program to drive incremental productivity by 2016 that will
primarily be redirected into increased media investments. Our incremental productivity goal consists of two relatively equal components. First, we will
expand savings through global supply chain optimization, data and information technology systems standardization, and resource and cost reallocation.
Second, we will increase the effectiveness of our marketing investments by transforming our marketing and commercial model to redeploy resources into
more consumer-facing marketing investments to accelerate growth.
In October 2014, the Company announced that we were further expanding our productivity and reinvestment program and extending it through 2019. The
expansion of the productivity initiatives will focus on four key areas: restructuring the Company's global supply chain, including manufacturing in North
America; implementing zero-based work, an evolution of zero-based budget principles, across the organization; streamlining and simplifying the Company's
operating model; and further driving increased discipline and efficiency in direct marketing investments.
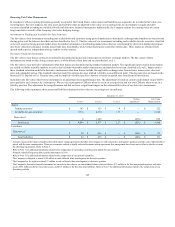
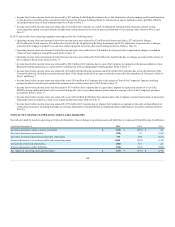
The Company has incurred total pretax expenses of $2,056 million related to this program since it commenced. These expenses were recorded in the line item
other operating charges in our consolidated statement of income. Refer to Note 19 for the impact these charges had on our operating segments. Outside
services reported in the table below primarily relate to expenses in connection with legal, outplacement and consulting activities. Other direct costs reported
in the table below include, among other items, internal and external costs associated with the development, communication, administration and
implementation of these initiatives; accelerated depreciation on certain fixed assets; contract termination fees; and relocation costs.
135