Coca Cola 2015 Annual Report Download - page 64
Download and view the complete annual report
Please find page 64 of the 2015 Coca Cola annual report below. You can navigate through the pages in the report by either clicking on the pages listed below, or by using the keyword search tool below to find specific information within the annual report.-
 1
1 -
2
-
3
-
4
-
5
-
6
-
7
-
8
-
9
-
10
-
11
-
12
-
13
-
14
-
15
-
16
-
17
-
18
-
19
-
20
-
21
-
22
-
23
-
24
-
25
-
26
-
27
-
28
-
29
-
30
-
31
-
32
-
33
-
34
-
35
-
36
-
37
-
38
-
39
-
40
-
41
-
42
-
43
-
44
-
45
-
46
-
47
-
48
-
49
-
50
-
51
-
52
-
53
-
 54
54 -
 55
55 -
 56
56 -
 57
57 -
 58
58 -
 59
59 -
 60
60 -
 61
61 -
 62
62 -
 63
63 -
 64
64 -
 65
65 -
 66
66 -
 67
67 -
 68
68 -
 69
69 -
 70
70 -
 71
71 -
 72
72 -
 73
73 -
 74
74 -
75
-
76
-
77
-
78
-
79
-
80
-
81
-
82
-
83
-
84
-
85
-
86
-
87
-
88
-
89
-
90
-
91
-
92
-
93
-
94
-
95
-
96
-
97
-
98
-
99
-
100
-
101
-
102
-
103
-
104
-
105
-
106
-
107
-
108
-
109
-
110
-
111
-
112
-
113
-
114
-
115
-
116
-
117
-
118
-
119
-
120
-
121
-
122
-
123
-
124
-
125
-
126
-
127
-
128
-
129
-
130
-
131
-
132
-
133
-
134
-
135
-
136
-
137
-
138
-
139
-
140
-
141
-
142
-
143
-
144
-
145
-
146
-
147
-
148
-
149
-
150
-
151
-
152
-
153
-
154
-
155
-
156
-
157
-
158
-
159
-
160
-
161
-
162
-
163
-
164
-
165
-
166
-
167
-
168
-
169
-
170
-
171
-
172
-
173
-
174
-
175
-
176
-
177
-
178
-
179
-
180
-
181
-
182
-
183
-
184
-
185
-
186
-
187
-
188
-
189
-
190
-
191
-
192
-
193
-
194
-
195
-
196
-
197
-
198
-
199
-
200
-
201
-
202
-
203
-
204
-
205
-
206
-
207
-
208
-
209
-
210
-
211
-
212
-
213
-
214
-
215
-
216
-
217
-
218
-
219
-
220
 |
 |
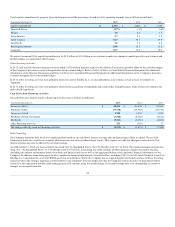
Net operating revenues in the United States were $20.4 billion in 2015, or 46 percent of the Company's consolidated net operating revenues. We expect
existing domestic cash, cash equivalents, short-term investments, marketable securities, cash flows from operations and the issuance of debt to continue to be
sufficient to fund our domestic operating activities and cash commitments for investing and financing activities. In addition, we expect existing foreign cash,
cash equivalents, short-term investments, marketable securities and cash flows from operations to continue to be sufficient to fund our foreign operating
activities and cash commitments for investing activities.
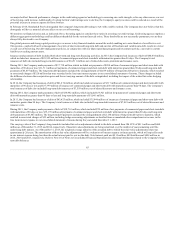
In the future, should we require more capital to fund significant discretionary activities in the United States than is generated by our domestic operations and
is available through the issuance of domestic debt, we could elect to repatriate future periods' earnings from foreign jurisdictions. This alternative could result
in a higher effective tax rate in the future. While the likelihood is remote, the Company could also elect to repatriate earnings from foreign jurisdictions that
have previously been considered to be indefinitely reinvested. Upon distribution of those earnings in the form of dividends or otherwise, the Company would
be subject to additional U.S. income taxes (net of an adjustment for foreign tax credits) and withholding taxes payable to various foreign jurisdictions, where
applicable. This alternative could also result in a higher effective tax rate in the period in which such a determination is made to repatriate prior period
foreign earnings. Refer to Note 14 of Notes to Consolidated Financial Statements for further information related to our income taxes and undistributed
earnings of the Company's foreign subsidiaries.
Based on all the aforementioned factors, the Company believes its current liquidity position is strong, and we will continue to meet all of our financial
commitments for the foreseeable future. These obligations and anticipated cash outflows include, but are not limited to, regular quarterly dividends, debt
maturities, capital expenditures, share repurchases and obligations included under the heading "Off-Balance Sheet Arrangements and Aggregate Contractual
Obligations" below.
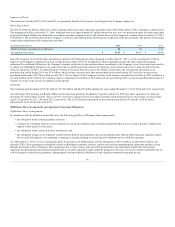
Cash Flows from Operating Activities
Net cash provided by operating activities for the years ended December 31, 2015, 2014 and 2013 was $10,528 million, $10,615 million and $10,542 million,
respectively.
Cash flows from operating activities decreased $87 million, or 1 percent, in 2015 compared to 2014. This decrease primarily reflects the impact of foreign
currency fluctuations and an increase in tax payments, partially offset by the efficient management of working capital. Refer to the heading "Operations
Review — Net Operating Revenues" above for additional information on the impact of foreign currency fluctuations. Refer to Note 14 of Notes to
Consolidated Financial Statements for additional information on the tax payments.
Cash flows from operating activities increased $73 million, or 1 percent, in 2014 compared to 2013. This increase primarily reflects the incremental pension
contributions that were made in the first quarter of 2013 compared to 2014 as well as efficient management of working capital. The increase was partially
offset by an unfavorable impact of currency exchange rates during 2014. Refer to the heading "Operations Review — Net Operating Revenues" above for
additional information on the impact of foreign currency fluctuations.
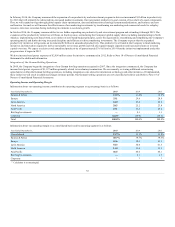
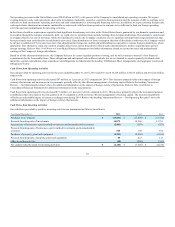
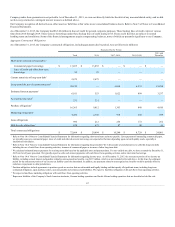
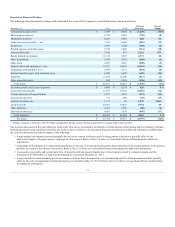
Cash Flows from Investing Activities
Our cash flows provided by (used in) investing activities are summarized as follows (in millions):
Year Ended December 31,
2014
2013
Purchases of investments
$ (17,800)
$ (14,782)
Proceeds from disposals of investments
12,986
12,791
Acquisitions of businesses, equity method investments and nonmarketable securities
(389)
(353)
Proceeds from disposals of businesses, equity method investments and nonmarketable
securities
148
872
Purchases of property, plant and equipment
(2,406)
(2,550)
Proceeds from disposals of property, plant and equipment
223
111
Other investing activities
(268)
(303)
Net cash provided by (used in) investing activities
$ (7,506)
$ (4,214)
62