Coca Cola 2015 Annual Report Download - page 61
Download and view the complete annual report
Please find page 61 of the 2015 Coca Cola annual report below. You can navigate through the pages in the report by either clicking on the pages listed below, or by using the keyword search tool below to find specific information within the annual report.-
 1
1 -
2
-
3
-
4
-
5
-
6
-
7
-
8
-
9
-
10
-
11
-
12
-
13
-
14
-
15
-
16
-
17
-
18
-
19
-
20
-
21
-
22
-
23
-
24
-
25
-
26
-
27
-
28
-
29
-
30
-
31
-
32
-
33
-
34
-
35
-
36
-
37
-
38
-
39
-
40
-
41
-
42
-
43
-
44
-
45
-
46
-
47
-
48
-
49
-
50
-
 51
51 -
 52
52 -
 53
53 -
 54
54 -
 55
55 -
 56
56 -
 57
57 -
 58
58 -
 59
59 -
 60
60 -
 61
61 -
 62
62 -
 63
63 -
 64
64 -
 65
65 -
 66
66 -
 67
67 -
 68
68 -
 69
69 -
 70
70 -
 71
71 -
72
-
73
-
74
-
75
-
76
-
77
-
78
-
79
-
80
-
81
-
82
-
83
-
84
-
85
-
86
-
87
-
88
-
89
-
90
-
91
-
92
-
93
-
94
-
95
-
96
-
97
-
98
-
99
-
100
-
101
-
102
-
103
-
104
-
105
-
106
-
107
-
108
-
109
-
110
-
111
-
112
-
113
-
114
-
115
-
116
-
117
-
118
-
119
-
120
-
121
-
122
-
123
-
124
-
125
-
126
-
127
-
128
-
129
-
130
-
131
-
132
-
133
-
134
-
135
-
136
-
137
-
138
-
139
-
140
-
141
-
142
-
143
-
144
-
145
-
146
-
147
-
148
-
149
-
150
-
151
-
152
-
153
-
154
-
155
-
156
-
157
-
158
-
159
-
160
-
161
-
162
-
163
-
164
-
165
-
166
-
167
-
168
-
169
-
170
-
171
-
172
-
173
-
174
-
175
-
176
-
177
-
178
-
179
-
180
-
181
-
182
-
183
-
184
-
185
-
186
-
187
-
188
-
189
-
190
-
191
-
192
-
193
-
194
-
195
-
196
-
197
-
198
-
199
-
200
-
201
-
202
-
203
-
204
-
205
-
206
-
207
-
208
-
209
-
210
-
211
-
212
-
213
-
214
-
215
-
216
-
217
-
218
-
219
-
220
 |
 |

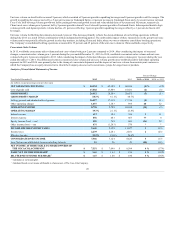
Other Income (Loss) — Net
Other income (loss) — net includes, among other things, the impact of foreign currency exchange gains and losses; dividend income; rental income; gains
and losses related to the disposal of property, plant and equipment; gains and losses related to business combinations and disposals; realized and unrealized
gains and losses on trading securities; realized gains and losses on available-for-sale securities; other-than-temporary impairments of available-for-sale
securities; and the accretion of expense related to certain acquisitions. The foreign currency exchange gains and losses are primarily the result of the
remeasurement of monetary assets and liabilities from certain currencies into functional currencies. The effects of the remeasurement of these assets and
liabilities are partially offset by the impact of our economic hedging program for certain exposures on our consolidated balance sheets. Refer to Note 5 of
Notes to Consolidated Financial Statements.
In 2015, other income (loss) — net was income of $631 million. This income included a net gain of $1,403 million as a result the Monster Transaction,
primarily due to the difference in the recorded carrying value of the assets transferred, including an allocated portion of goodwill, compared to the value of
the total assets and business acquired. Other income (loss) — net also included net foreign currency exchange gains of $149 million and dividend income of
$83 million. This income was partially offset by noncash losses of $1,006 million due to refranchising activities in North America. The net foreign currency
exchange gains included a gain of $300 million associated with our foreign-denominated debt partially offset by a charge of $27 million due to the initial
remeasurement of the net monetary assets of our Venezuelan subsidiary using the SIMADI exchange rate. The Company determined that based on its
economic circumstances, the SIMADI rate best represented the applicable rate at which future transactions could be settled, including the payment of
dividends. As such, the Company remeasured the net assets related to its operations in Venezuela using the current SIMADI rate. Refer to Note 2 of Notes to
Consolidated Financial Statements for additional information on the Monster Transaction and North America refranchising. Refer to the heading "Liquidity,
Capital Resources and Financial Position — Foreign Exchange" below and Note 1 of Notes to Consolidated Financial Statements for additional information
on the charge due to the change in Venezuelan exchange rates.
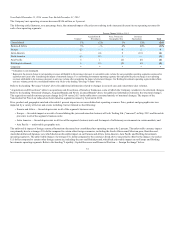
In 2014, other income (loss) — net was a loss of $1,263 million, primarily due to noncash losses of $799 million related to the refranchising of certain
territories in North America and foreign exchange losses of $569 million, including a charge of $372 million due to the remeasurement of the net monetary
assets of our Venezuelan subsidiary using the SICAD 2 exchange rate. These charges were partially offset by dividend income of $51 million and net gains of
$45 million related to fluctuations in the carrying value of the Company's trading securities and sales of available-for-sale securities. Refer to Note 1, Note 2
and Note 17 of Notes to Consolidated Financial Statements.
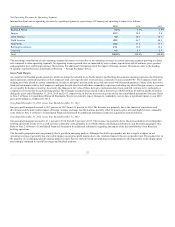
In 2013, other income (loss) — net was income of $576 million, primarily related to a gain of $615 million due to the deconsolidation of our Brazilian
bottling operations as a result of their combination with an independent bottling partner; a gain of $139 million as a result of Coca-Cola FEMSA, an equity
method investee, issuing additional shares of its own stock at per share amounts greater than the carrying value of the Company's per share investment; and
dividend income of $70 million. The favorable impact of these items was partially offset by a charge of $140 million due to the devaluation of the
Venezuelan bolivar, which resulted in the Company remeasuring the net assets related to its operations in Venezuela, and a net charge of $114 million related
to our investment in four bottling partners that merged during 2013 to form CCEJ through a share exchange. Refer to Note 2 and Note 17 of Notes to
Consolidated Financial Statements.
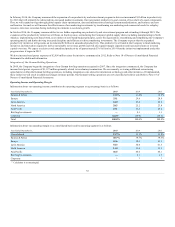
Income Taxes
Our effective tax rate reflects the tax benefits of having significant operations outside the United States, which are generally taxed at rates lower than the U.S.
statutory rate of 35.0 percent. As a result of employment actions and capital investments made by the Company, certain tax jurisdictions provide income tax
incentive grants, including Brazil, Costa Rica, Singapore and Swaziland. The terms of these grants expire from 2016 to 2023. We anticipate that we will be
able to extend or renew the grants in these locations. Tax incentive grants favorably impacted our income tax expense by $223 million, $265 million and
$279 million for the years ended December 31, 2015, 2014 and 2013, respectively. In addition, our effective tax rate reflects the benefits of having
significant earnings generated in investments accounted for under the equity method of accounting, which are generally taxed at rates lower than the U.S.
statutory rate.
59