Coca Cola 2015 Annual Report Download - page 55
Download and view the complete annual report
Please find page 55 of the 2015 Coca Cola annual report below. You can navigate through the pages in the report by either clicking on the pages listed below, or by using the keyword search tool below to find specific information within the annual report.-
 1
1 -
2
-
3
-
4
-
5
-
6
-
7
-
8
-
9
-
10
-
11
-
12
-
13
-
14
-
15
-
16
-
17
-
18
-
19
-
20
-
21
-
22
-
23
-
24
-
25
-
26
-
27
-
28
-
29
-
30
-
31
-
32
-
33
-
34
-
35
-
36
-
37
-
38
-
39
-
40
-
41
-
42
-
43
-
44
-
 45
45 -
 46
46 -
 47
47 -
 48
48 -
 49
49 -
 50
50 -
 51
51 -
 52
52 -
 53
53 -
 54
54 -
 55
55 -
 56
56 -
 57
57 -
 58
58 -
 59
59 -
 60
60 -
 61
61 -
 62
62 -
 63
63 -
 64
64 -
 65
65 -
66
-
67
-
68
-
69
-
70
-
71
-
72
-
73
-
74
-
75
-
76
-
77
-
78
-
79
-
80
-
81
-
82
-
83
-
84
-
85
-
86
-
87
-
88
-
89
-
90
-
91
-
92
-
93
-
94
-
95
-
96
-
97
-
98
-
99
-
100
-
101
-
102
-
103
-
104
-
105
-
106
-
107
-
108
-
109
-
110
-
111
-
112
-
113
-
114
-
115
-
116
-
117
-
118
-
119
-
120
-
121
-
122
-
123
-
124
-
125
-
126
-
127
-
128
-
129
-
130
-
131
-
132
-
133
-
134
-
135
-
136
-
137
-
138
-
139
-
140
-
141
-
142
-
143
-
144
-
145
-
146
-
147
-
148
-
149
-
150
-
151
-
152
-
153
-
154
-
155
-
156
-
157
-
158
-
159
-
160
-
161
-
162
-
163
-
164
-
165
-
166
-
167
-
168
-
169
-
170
-
171
-
172
-
173
-
174
-
175
-
176
-
177
-
178
-
179
-
180
-
181
-
182
-
183
-
184
-
185
-
186
-
187
-
188
-
189
-
190
-
191
-
192
-
193
-
194
-
195
-
196
-
197
-
198
-
199
-
200
-
201
-
202
-
203
-
204
-
205
-
206
-
207
-
208
-
209
-
210
-
211
-
212
-
213
-
214
-
215
-
216
-
217
-
218
-
219
-
220
 |
 |

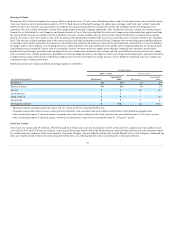
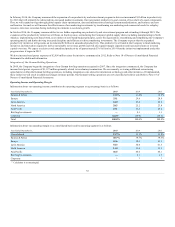
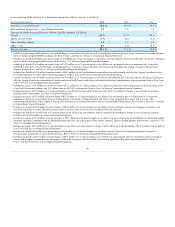
Selling, General and Administrative Expenses
The following table sets forth the significant components of selling, general and administrative expenses (in millions):
Year Ended December 31,
2014
2013
Stock-based compensation expense
$ 209
$ 227
Advertising expenses
3,499
3,266
Selling and distribution expenses
6,412
6,419
Other operating expenses
7,098
7,398
Selling, general and administrative expenses
$ 17,218
$ 17,310
Year Ended December 31, 2015 versus Year Ended December 31, 2014
Selling, general and administrative expenses decreased $791 million, or 5 percent. During the year ended December 31, 2015, fluctuations in foreign
currency decreased selling, general and administrative expenses by 6 percent. The increase in stock-based compensation was primarily due to reversals in
2014 of previously recognized expenses related to the Company's long-term incentive programs as performance criteria were not achieved. The increase in
advertising expenses reflects the Company's increased investments to strengthen our brands, partially offset by a foreign currency exchange impact of
13 percent. The decrease in selling and distribution expenses reflects the impact of acquisitions and divestitures. The decrease in other operating expenses
reflects the shift of the Company's marketing spending to more consumer-facing advertising expenses as well as savings from our productivity and
reinvestment initiatives. Foreign currency exchange rate fluctuations have a more significant impact on both advertising and other operating expenses as
compared to our selling and distribution expenses since they are generally transacted in local currency. Our selling and distribution expenses are primarily
related to our Company-owned bottling operations, of which the majority of expenses are attributable to CCR and are primarily denominated in U.S. dollars.
Refer to Note 2 of Notes to Consolidated Financial Statements for additional information related to acquisitions and divestitures.
In 2016, our pension expense is expected to decrease by $200 million compared to 2015. The anticipated decrease is primarily due to settlement and special
termination costs incurred in 2015 of $169 million, the new method to calculate service and interest costs, an increase in the weighted-average discount rate
used to calculate the Company's benefit obligations and the impact of $471 million of contributions the Company made in early 2016 to U.S. pension plans.
The impact of these items will be partially offset by unfavorable asset performance compared to our expected return during 2015 and a decrease in the
expected return on assets for U.S. plans. Refer to the heading "Liquidity, Capital Resources and Financial Position" below for information related to these
contributions. Refer to the heading "Critical Accounting Policies and Estimates — Pension Plan Valuations" above and Note 13 of Notes to Consolidated
Financial Statements for additional information related to the pension plan assumptions used by the Company.
As of December 31, 2015, we had $319 million of total unrecognized compensation cost related to nonvested share-based compensation arrangements
granted under our plans. This cost is expected to be recognized over a weighted-average period of 1.8 years as stock-based compensation expense. This
expected cost does not include the impact of any future stock-based compensation awards. Refer to Note 12 of Notes to Consolidated Financial Statements.
Year Ended December 31, 2014 versus Year Ended December 31, 2013
Selling, general and administrative expenses decreased $92 million, or 1 percent. Foreign currency fluctuations decreased selling, general and administrative
expenses by 2 percent. The decrease in stock-based compensation was primarily due to reversals in 2014 of previously recognized expenses related to the
Company's long-term incentive compensation programs. The increase in advertising expenses reflects the company's increased investment to strengthen our
brands. This increase was partially offset by a foreign currency exchange impact of 4 percent. The decrease in selling and distribution expenses is a result of
the refranchising of certain territories in North America in 2014 and the deconsolidation of our Brazilian bottling operations as a result of their combination
with an independent bottling partner in July 2013.
53