Coca Cola 2015 Annual Report Download - page 121
Download and view the complete annual report
Please find page 121 of the 2015 Coca Cola annual report below. You can navigate through the pages in the report by either clicking on the pages listed below, or by using the keyword search tool below to find specific information within the annual report.-
 1
1 -
2
-
3
-
4
-
5
-
6
-
7
-
8
-
9
-
10
-
11
-
12
-
13
-
14
-
15
-
16
-
17
-
18
-
19
-
20
-
21
-
22
-
23
-
24
-
25
-
26
-
27
-
28
-
29
-
30
-
31
-
32
-
33
-
34
-
35
-
36
-
37
-
38
-
39
-
40
-
41
-
42
-
43
-
44
-
45
-
46
-
47
-
48
-
49
-
50
-
51
-
52
-
53
-
54
-
55
-
56
-
57
-
58
-
59
-
60
-
61
-
62
-
63
-
64
-
65
-
66
-
67
-
68
-
69
-
70
-
71
-
72
-
73
-
74
-
75
-
76
-
77
-
78
-
79
-
80
-
81
-
82
-
83
-
84
-
85
-
86
-
87
-
88
-
89
-
90
-
91
-
92
-
93
-
94
-
95
-
96
-
97
-
98
-
99
-
100
-
101
-
102
-
103
-
104
-
105
-
106
-
107
-
108
-
109
-
110
-
 111
111 -
 112
112 -
 113
113 -
 114
114 -
 115
115 -
 116
116 -
 117
117 -
 118
118 -
 119
119 -
 120
120 -
 121
121 -
 122
122 -
 123
123 -
 124
124 -
 125
125 -
 126
126 -
 127
127 -
 128
128 -
 129
129 -
 130
130 -
 131
131 -
132
-
133
-
134
-
135
-
136
-
137
-
138
-
139
-
140
-
141
-
142
-
143
-
144
-
145
-
146
-
147
-
148
-
149
-
150
-
151
-
152
-
153
-
154
-
155
-
156
-
157
-
158
-
159
-
160
-
161
-
162
-
163
-
164
-
165
-
166
-
167
-
168
-
169
-
170
-
171
-
172
-
173
-
174
-
175
-
176
-
177
-
178
-
179
-
180
-
181
-
182
-
183
-
184
-
185
-
186
-
187
-
188
-
189
-
190
-
191
-
192
-
193
-
194
-
195
-
196
-
197
-
198
-
199
-
200
-
201
-
202
-
203
-
204
-
205
-
206
-
207
-
208
-
209
-
210
-
211
-
212
-
213
-
214
-
215
-
216
-
217
-
218
-
219
-
220
 |
 |

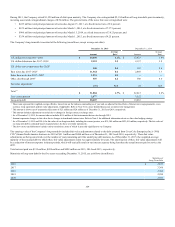
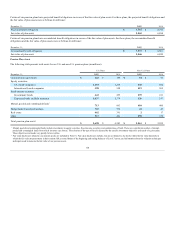
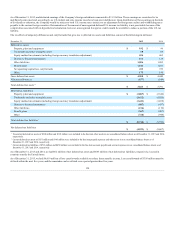
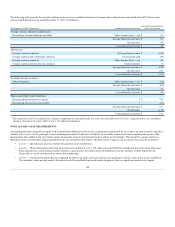
The following table sets forth the changes in AOCI for our benefit plans (in millions, pretax):
Pension Benefits
Other Benefits
Year Ended December 31,
2014
2014
Balance in AOCI at beginning of year
$ (1,537)
$ 13
Recognized prior service cost (credit)
(2)
(17)
Recognized net actuarial loss (gain)
77
2
Prior service credit (cost) arising in current year
—
31
Net actuarial (loss) gain arising in current year
(1,658)
(97)
Foreign currency translation gain (loss)
51
1
Balance in AOCI at end of year
$ (3,069)
$ (67)
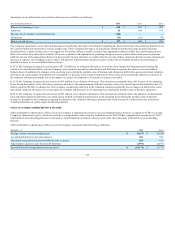
The following table sets forth amounts in AOCI for our benefit plans (in millions, pretax):
Pension Benefits
Other Benefits
December 31,
2014
2014
Prior service credit (cost)
$ 10
$ 100
Net actuarial loss
(3,079)
(167)
Balance in AOCI at end of year
$ (3,069)
$ (67)
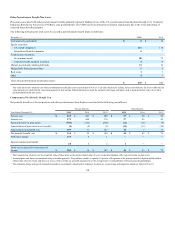
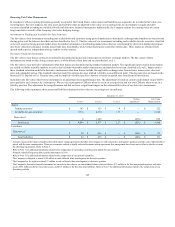
Amounts in AOCI expected to be recognized as components of net periodic pension cost in 2016 are as follows (in millions, pretax):
Pension Benefits
Other Benefits
Amortization of prior service cost (credit) $ (2)
$ (19)
Amortization of actuarial loss 181
7
Total $ 179
$ (12)
Assumptions
Certain weighted-average assumptions used in computing the benefit obligations are as follows:
Pension Benefits
Other Benefits
December 31,
2014
2014
Discount rate
3.75%
3.75%
Rate of increase in compensation levels
3.50%
N/A
119