Coca Cola 2015 Annual Report Download - page 106
Download and view the complete annual report
Please find page 106 of the 2015 Coca Cola annual report below. You can navigate through the pages in the report by either clicking on the pages listed below, or by using the keyword search tool below to find specific information within the annual report.-
 1
1 -
2
-
3
-
4
-
5
-
6
-
7
-
8
-
9
-
10
-
11
-
12
-
13
-
14
-
15
-
16
-
17
-
18
-
19
-
20
-
21
-
22
-
23
-
24
-
25
-
26
-
27
-
28
-
29
-
30
-
31
-
32
-
33
-
34
-
35
-
36
-
37
-
38
-
39
-
40
-
41
-
42
-
43
-
44
-
45
-
46
-
47
-
48
-
49
-
50
-
51
-
52
-
53
-
54
-
55
-
56
-
57
-
58
-
59
-
60
-
61
-
62
-
63
-
64
-
65
-
66
-
67
-
68
-
69
-
70
-
71
-
72
-
73
-
74
-
75
-
76
-
77
-
78
-
79
-
80
-
81
-
82
-
83
-
84
-
85
-
86
-
87
-
88
-
89
-
90
-
91
-
92
-
93
-
94
-
95
-
 96
96 -
 97
97 -
 98
98 -
 99
99 -
 100
100 -
 101
101 -
 102
102 -
 103
103 -
 104
104 -
 105
105 -
 106
106 -
 107
107 -
 108
108 -
 109
109 -
 110
110 -
 111
111 -
 112
112 -
 113
113 -
 114
114 -
 115
115 -
 116
116 -
117
-
118
-
119
-
120
-
121
-
122
-
123
-
124
-
125
-
126
-
127
-
128
-
129
-
130
-
131
-
132
-
133
-
134
-
135
-
136
-
137
-
138
-
139
-
140
-
141
-
142
-
143
-
144
-
145
-
146
-
147
-
148
-
149
-
150
-
151
-
152
-
153
-
154
-
155
-
156
-
157
-
158
-
159
-
160
-
161
-
162
-
163
-
164
-
165
-
166
-
167
-
168
-
169
-
170
-
171
-
172
-
173
-
174
-
175
-
176
-
177
-
178
-
179
-
180
-
181
-
182
-
183
-
184
-
185
-
186
-
187
-
188
-
189
-
190
-
191
-
192
-
193
-
194
-
195
-
196
-
197
-
198
-
199
-
200
-
201
-
202
-
203
-
204
-
205
-
206
-
207
-
208
-
209
-
210
-
211
-
212
-
213
-
214
-
215
-
216
-
217
-
218
-
219
-
220
 |
 |

Our consolidated net income includes our Company's proportionate share of the net income or loss of our equity method investees. When we record our
proportionate share of net income, it increases equity income (loss) — net in our consolidated statements of income and our carrying value in that
investment. Conversely, when we record our proportionate share of a net loss, it decreases equity income (loss) — net in our consolidated statements of
income and our carrying value in that investment. The Company's proportionate share of the net income or loss of our equity method investees includes
significant operating and nonoperating items recorded by our equity method investees. These items can have a significant impact on the amount of equity
income (loss) — net in our consolidated statements of income and our carrying value in those investments. Refer to Note 17 for additional information
related to significant operating and nonoperating items recorded by our equity method investees. The carrying values of our equity method investments are
also impacted by our proportionate share of items impacting the equity investee's AOCI.
We eliminate from our financial results all significant intercompany transactions, including the intercompany portion of transactions with equity method
investees.
The Company's equity method investments include our ownership interests in Coca-Cola FEMSA, Coca-Cola Hellenic, Coca-Cola Amatil Limited and
Monster. As of December 31, 2015, we owned approximately 28 percent, 24 percent, 29 percent and 17 percent, respectively, of these companies' outstanding
shares. As of December 31, 2015, our investment in our equity method investees in the aggregate exceeded our proportionate share of the net assets of these
equity method investees by $4,306 million. This difference is not amortized.
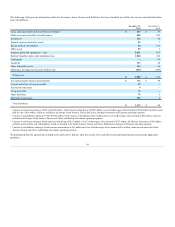
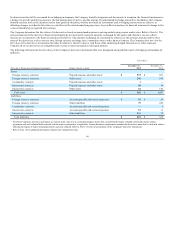
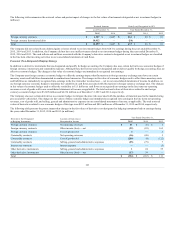
A summary of financial information for our equity method investees in the aggregate is as follows (in millions):
Year Ended December 31,1
2014
2013
Net operating revenues
$ 52,627
$ 53,038
Cost of goods sold
31,810
32,377
Gross profit
$ 20,817
$ 20,661
Operating income
$ 4,489
$ 4,380
Consolidated net income
$ 2,440
$ 2,364
Less: Net income attributable to noncontrolling interests
74
62
Net income attributable to common shareowners
$ 2,366
$ 2,302
Equity income (loss) — net
$ 769
$ 602
1 The financial information represents the results of the equity method investees during the Company's period of ownership.
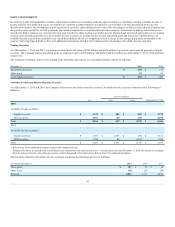
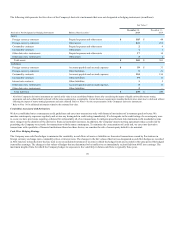
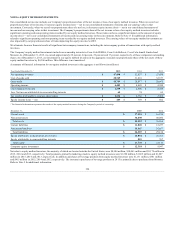
December 31,
2014
Current assets
$ 16,184
Noncurrent assets
40,080
Total assets
$ 56,264
Current liabilities
$ 12,477
Noncurrent liabilities
16,657
Total liabilities
$ 29,134
Equity attributable to shareowners of investees
$ 26,363
Equity attributable to noncontrolling interests
767
Total equity
$ 27,130
Company equity investment
$ 9,947
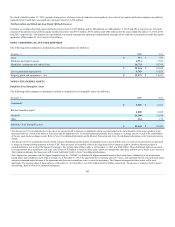
Net sales to equity method investees, the majority of which are located outside the United States, were $8,984 million, $10,063 million and $9,178 million in
2015, 2014 and 2013, respectively. Total payments, primarily marketing, made to equity method investees were $1,380 million, $1,605 million and $1,807
million in 2015, 2014 and 2013, respectively. In addition, purchases of beverage products from equity method investees were $1,131 million, $381 million
and $415 million in 2015, 2014 and 2013, respectively. The increase in purchases of beverage products in 2015 is primarily due to purchases from Monster.
Refer to Note 2 for additional information.
104