Coca Cola 2015 Annual Report Download - page 120
Download and view the complete annual report
Please find page 120 of the 2015 Coca Cola annual report below. You can navigate through the pages in the report by either clicking on the pages listed below, or by using the keyword search tool below to find specific information within the annual report.-
 1
1 -
2
-
3
-
4
-
5
-
6
-
7
-
8
-
9
-
10
-
11
-
12
-
13
-
14
-
15
-
16
-
17
-
18
-
19
-
20
-
21
-
22
-
23
-
24
-
25
-
26
-
27
-
28
-
29
-
30
-
31
-
32
-
33
-
34
-
35
-
36
-
37
-
38
-
39
-
40
-
41
-
42
-
43
-
44
-
45
-
46
-
47
-
48
-
49
-
50
-
51
-
52
-
53
-
54
-
55
-
56
-
57
-
58
-
59
-
60
-
61
-
62
-
63
-
64
-
65
-
66
-
67
-
68
-
69
-
70
-
71
-
72
-
73
-
74
-
75
-
76
-
77
-
78
-
79
-
80
-
81
-
82
-
83
-
84
-
85
-
86
-
87
-
88
-
89
-
90
-
91
-
92
-
93
-
94
-
95
-
96
-
97
-
98
-
99
-
100
-
101
-
102
-
103
-
104
-
105
-
106
-
107
-
108
-
109
-
 110
110 -
 111
111 -
 112
112 -
 113
113 -
 114
114 -
 115
115 -
 116
116 -
 117
117 -
 118
118 -
 119
119 -
 120
120 -
 121
121 -
 122
122 -
 123
123 -
 124
124 -
 125
125 -
 126
126 -
 127
127 -
 128
128 -
 129
129 -
 130
130 -
131
-
132
-
133
-
134
-
135
-
136
-
137
-
138
-
139
-
140
-
141
-
142
-
143
-
144
-
145
-
146
-
147
-
148
-
149
-
150
-
151
-
152
-
153
-
154
-
155
-
156
-
157
-
158
-
159
-
160
-
161
-
162
-
163
-
164
-
165
-
166
-
167
-
168
-
169
-
170
-
171
-
172
-
173
-
174
-
175
-
176
-
177
-
178
-
179
-
180
-
181
-
182
-
183
-
184
-
185
-
186
-
187
-
188
-
189
-
190
-
191
-
192
-
193
-
194
-
195
-
196
-
197
-
198
-
199
-
200
-
201
-
202
-
203
-
204
-
205
-
206
-
207
-
208
-
209
-
210
-
211
-
212
-
213
-
214
-
215
-
216
-
217
-
218
-
219
-
220
 |
 |

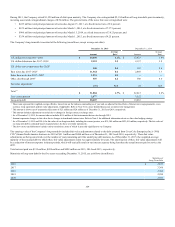
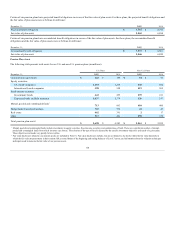
Other Postretirement Benefit Plan Assets
Plan assets associated with other postretirement benefits primarily represent funding of one of the U.S. postretirement benefit plans through a U.S. Voluntary
Employee Beneficiary Association ("VEBA"), a tax-qualified trust. The VEBA assets are primarily invested in liquid assets due to the level and timing of
expected future benefit payments.
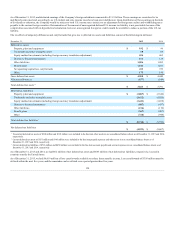
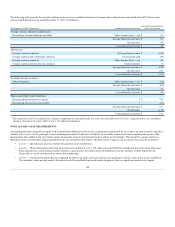
The following table presents total assets for our other postretirement benefit plans (in millions):
December 31,
2014
Cash and cash equivalents
$ 10
Equity securities:
U.S.-based companies
114
International-based companies
7
Fixed-income securities:
Government bonds
79
Corporate bonds and debt securities
9
Mutual, pooled and commingled funds
16
Hedge funds/limited partnerships
5
Real estate
3
Other
3
Total other postretirement benefit plan assets1
$ 246
1 Fair value disclosures related to our other postretirement benefit plan assets are included in Note 16. Fair value disclosures include, but are not limited to, the levels within the fair
value hierarchy in which the fair value measurements in their entirety fall and information about the valuation techniques and inputs used to measure the fair value of our other
postretirement benefit plan assets.
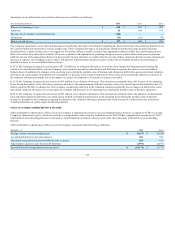
Components of Net Periodic Benefit Cost
Net periodic benefit cost for our pension and other postretirement benefit plans consisted of the following (in millions):
Pension Benefits
Other Benefits
Year Ended December 31,
2014
2013
2014
2013
Service cost
$ 261
$ 280
$ 26
$ 36
Interest cost
406
378
43
42
Expected return on plan assets1
(713)
(659)
(11)
(9)
Amortization of prior service cost (credit)
(2)
(2)
(17)
(10)
Amortization of actuarial loss2
73
197
2
13
Net periodic benefit cost
$ 25
$ 194
$ 43
$ 72
Settlement charge3
4
1
—
—
Special termination benefits3
5
2
—
—
Total cost recognized in statements of
income
$ 34
$ 197
$ 43
$ 72
1 The Company has elected to use the actual fair value of plan assets as the market-related value of assets in the determination of the expected return on plan assets.
2 Actuarial gains and losses are amortized using a corridor approach. The gain/loss corridor is equal to 10 percent of the greater of the pension benefit obligation and the market-
related value of assets. Gains and losses in excess of the corridor are generally amortized over the average future working lifetime of the pension plan participants.
3 The settlement charge and special termination benefits were primarily related to the Company's productivity, restructuring and integration initiatives. Refer to Note 18.
118