Coca Cola 2015 Annual Report Download - page 115
Download and view the complete annual report
Please find page 115 of the 2015 Coca Cola annual report below. You can navigate through the pages in the report by either clicking on the pages listed below, or by using the keyword search tool below to find specific information within the annual report.-
 1
1 -
2
-
3
-
4
-
5
-
6
-
7
-
8
-
9
-
10
-
11
-
12
-
13
-
14
-
15
-
16
-
17
-
18
-
19
-
20
-
21
-
22
-
23
-
24
-
25
-
26
-
27
-
28
-
29
-
30
-
31
-
32
-
33
-
34
-
35
-
36
-
37
-
38
-
39
-
40
-
41
-
42
-
43
-
44
-
45
-
46
-
47
-
48
-
49
-
50
-
51
-
52
-
53
-
54
-
55
-
56
-
57
-
58
-
59
-
60
-
61
-
62
-
63
-
64
-
65
-
66
-
67
-
68
-
69
-
70
-
71
-
72
-
73
-
74
-
75
-
76
-
77
-
78
-
79
-
80
-
81
-
82
-
83
-
84
-
85
-
86
-
87
-
88
-
89
-
90
-
91
-
92
-
93
-
94
-
95
-
96
-
97
-
98
-
99
-
100
-
101
-
102
-
103
-
104
-
 105
105 -
 106
106 -
 107
107 -
 108
108 -
 109
109 -
 110
110 -
 111
111 -
 112
112 -
 113
113 -
 114
114 -
 115
115 -
 116
116 -
 117
117 -
 118
118 -
 119
119 -
 120
120 -
 121
121 -
 122
122 -
 123
123 -
 124
124 -
 125
125 -
126
-
127
-
128
-
129
-
130
-
131
-
132
-
133
-
134
-
135
-
136
-
137
-
138
-
139
-
140
-
141
-
142
-
143
-
144
-
145
-
146
-
147
-
148
-
149
-
150
-
151
-
152
-
153
-
154
-
155
-
156
-
157
-
158
-
159
-
160
-
161
-
162
-
163
-
164
-
165
-
166
-
167
-
168
-
169
-
170
-
171
-
172
-
173
-
174
-
175
-
176
-
177
-
178
-
179
-
180
-
181
-
182
-
183
-
184
-
185
-
186
-
187
-
188
-
189
-
190
-
191
-
192
-
193
-
194
-
195
-
196
-
197
-
198
-
199
-
200
-
201
-
202
-
203
-
204
-
205
-
206
-
207
-
208
-
209
-
210
-
211
-
212
-
213
-
214
-
215
-
216
-
217
-
218
-
219
-
220
 |
 |
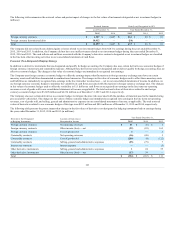
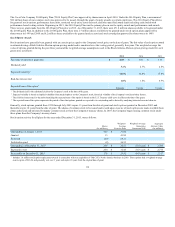
The total intrinsic value of the options exercised was $594 million, $894 million and $815 million in 2015, 2014 and 2013, respectively. The total shares
exercised were 44 million, 58 million and 53 million in 2015, 2014 and 2013, respectively.
Performance Share Unit Awards
Performance share units require achievement of certain performance criteria, which are predefined by the Compensation Committee of the Board of Directors
at the time of grant. The primary performance criterion used is compound annual growth in economic profit over a predefined performance period, which is
generally three years. Economic profit is our net operating profit after tax less the cost of the capital used in our business. Beginning in 2015, the Company
added net operating revenues as an additional performance criterion. Economic profit and net operating revenues are adjusted for certain items, which are
approved and certified by the Audit Committee of the Board of Directors. The purpose of these adjustments is to ensure a consistent year-to-year comparison
of the specific performance criteria. In the event the certified results equal the predefined performance criteria, the Company will grant the number of shares
equal to the target award. In the event the certified results exceed the predefined performance criteria, additional shares up to the maximum award will be
granted. In the event the certified results fall below the predefined performance criteria, a reduced number of shares will be granted. If the certified results fall
below the threshold award performance level, no shares will be granted. The performance share units granted under this program are then generally subject to
a holding period of one year before the shares are released.
Performance share units generally do not pay dividends or allow voting rights. For most performance share units granted beginning in 2014, the Company
includes a relative TSR modifier to determine the number of shares earned at the end of the performance period. For these awards, the number of shares earned
based on the certified achievement of the predefined performance criteria will be reduced or increased if total shareowner return over the performance period
relative to a predefined compensation comparator group of companies falls outside of a defined range. The fair value of performance share units that include
the TSR modifier is determined using a Monte Carlo valuation model. For the remaining awards that do not include the TSR modifier, the fair value of the
performance share units is the quoted market value of the Company stock on the grant date less the present value of the expected dividends not received
during the relevant period.
In the period it becomes probable that the minimum performance criteria specified in the plan will be achieved, we recognize expense for the proportionate
share of the total fair value of the performance share units related to the vesting period that has already lapsed for the shares expected to vest and be released.
The remaining fair value of the shares expected to vest and be released is expensed on a straight-line basis over the balance of the vesting period. In the event
the Company determines it is no longer probable that we will achieve the minimum performance criteria specified in the plan, we reverse all of the previously
recognized compensation expense in the period such a determination is made.
Performance share units are generally settled in stock, except for certain circumstances such as death or disability, in which case former employees or their
beneficiaries are provided a cash equivalent payment. As of December 31, 2015, performance share units of 5,115,000, 5,306,000 and 1,775,000 were
outstanding for the 2013–2015, 2014–2016 and 2015–2017 performance periods, respectively, based on the target award amounts in the performance share
unit agreements.
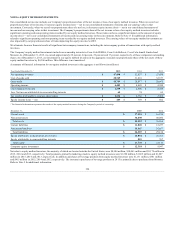
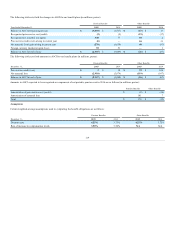
The following table summarizes information about performance share units based on the target award amounts in the performance share unit agreements:
Performance Share
Units
(In thousands)
Weighted-Average
Grant Date
Fair Value
Outstanding on January 1, 2015 17,426
$ 31.59
Granted11,857
37.99
Canceled/forfeited (7,087)
30.32
Outstanding on December 31, 20152
12,196
$ 33.30
1 Includes 70 percent of the total 2015 award. The remaining 30 percent of the 2015 award contained metrics that cannot be fully defined until 2017; therefore, these awards are not
considered granted until all of the metrics are established.
2 The outstanding performance share units as of December 31, 2015, at the threshold award and maximum award levels were 5.0 million and 20.9 million, respectively.
113