Coca Cola 2015 Annual Report Download - page 40
Download and view the complete annual report
Please find page 40 of the 2015 Coca Cola annual report below. You can navigate through the pages in the report by either clicking on the pages listed below, or by using the keyword search tool below to find specific information within the annual report.-
 1
1 -
2
-
3
-
4
-
5
-
6
-
7
-
8
-
9
-
10
-
11
-
12
-
13
-
14
-
15
-
16
-
17
-
18
-
19
-
20
-
21
-
22
-
23
-
24
-
25
-
26
-
27
-
28
-
29
-
 30
30 -
 31
31 -
 32
32 -
 33
33 -
 34
34 -
 35
35 -
 36
36 -
 37
37 -
 38
38 -
 39
39 -
 40
40 -
 41
41 -
 42
42 -
 43
43 -
 44
44 -
 45
45 -
 46
46 -
 47
47 -
 48
48 -
 49
49 -
 50
50 -
51
-
52
-
53
-
54
-
55
-
56
-
57
-
58
-
59
-
60
-
61
-
62
-
63
-
64
-
65
-
66
-
67
-
68
-
69
-
70
-
71
-
72
-
73
-
74
-
75
-
76
-
77
-
78
-
79
-
80
-
81
-
82
-
83
-
84
-
85
-
86
-
87
-
88
-
89
-
90
-
91
-
92
-
93
-
94
-
95
-
96
-
97
-
98
-
99
-
100
-
101
-
102
-
103
-
104
-
105
-
106
-
107
-
108
-
109
-
110
-
111
-
112
-
113
-
114
-
115
-
116
-
117
-
118
-
119
-
120
-
121
-
122
-
123
-
124
-
125
-
126
-
127
-
128
-
129
-
130
-
131
-
132
-
133
-
134
-
135
-
136
-
137
-
138
-
139
-
140
-
141
-
142
-
143
-
144
-
145
-
146
-
147
-
148
-
149
-
150
-
151
-
152
-
153
-
154
-
155
-
156
-
157
-
158
-
159
-
160
-
161
-
162
-
163
-
164
-
165
-
166
-
167
-
168
-
169
-
170
-
171
-
172
-
173
-
174
-
175
-
176
-
177
-
178
-
179
-
180
-
181
-
182
-
183
-
184
-
185
-
186
-
187
-
188
-
189
-
190
-
191
-
192
-
193
-
194
-
195
-
196
-
197
-
198
-
199
-
200
-
201
-
202
-
203
-
204
-
205
-
206
-
207
-
208
-
209
-
210
-
211
-
212
-
213
-
214
-
215
-
216
-
217
-
218
-
219
-
220
 |
 |
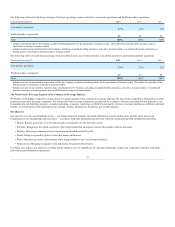
Management's assessments of the recoverability and impairment tests of noncurrent assets involve critical accounting estimates. These estimates require
significant management judgment, include inherent uncertainties and are often interdependent; therefore, they do not change in isolation. Factors that
management must estimate include, among others, the economic life of the asset, sales volume, pricing, cost of raw materials, delivery costs, inflation, cost of
capital, marketing spending, foreign currency exchange rates, tax rates, capital spending and proceeds from the sale of assets. These factors are even more
difficult to predict when global financial markets are highly volatile. The estimates we use when assessing the recoverability of current and noncurrent assets
are consistent with those we use in our internal planning. When performing impairment tests, we estimate the fair values of the assets using management's best
assumptions, which we believe would be consistent with what a hypothetical marketplace participant would use. Estimates and assumptions used in these
tests are evaluated and updated as appropriate. The variability of these factors depends on a number of conditions, including uncertainty about future events,
and thus our accounting estimates may change from period to period. If other assumptions and estimates had been used when these tests were performed,
impairment charges could have resulted. As mentioned above, these factors do not change in isolation and, therefore, we do not believe it is practicable or
meaningful to present the impact of changing a single factor. Furthermore, if management uses different assumptions or if different conditions occur in future
periods, future impairment charges could result. Refer to the heading "Operations Review" below for additional information related to our present business
environment. Certain factors discussed above are impacted by our current business environment and are discussed throughout this report, as appropriate.
Investments in Equity and Debt Securities
The carrying values of our investments in equity securities are determined using the equity method, the cost method or the fair value method. We account for
investments in companies that we do not control or account for under the equity method either at fair value or under the cost method, as applicable.
Investments in equity securities, other than investments accounted for under the equity method, are carried at fair value if the fair value of the security is
readily determinable. Equity investments carried at fair value are classified as either trading or available-for-sale securities. Realized and unrealized gains and
losses on trading securities and realized gains and losses on available-for-sale securities are included in net income. Unrealized gains and losses, net of
deferred taxes, on available-for-sale securities are included in our consolidated balance sheets as a component of accumulated other comprehensive income
(loss) ("AOCI"), except for the change in fair value attributable to the currency risk being hedged, if applicable, which is included in net income. Trading
securities are reported as either marketable securities or other assets in our consolidated balance sheets. Securities classified as available-for-sale are reported
as either marketable securities or other investments in our consolidated balance sheets, depending on the length of time we intend to hold the investment.
Investments in equity securities that do not qualify for fair value accounting or equity method accounting are accounted for under the cost method. In
accordance with the cost method, our initial investment is recorded at cost and we record dividend income when applicable dividends are declared. Cost
method investments are reported as other investments in our consolidated balance sheets.
Our investments in debt securities are carried at either amortized cost or fair value. Investments in debt securities that the Company has the positive intent
and ability to hold to maturity are carried at amortized cost and classified as held-to-maturity. Investments in debt securities that are not classified as held-to-
maturity are carried at fair value and classified as either trading or available-for-sale.
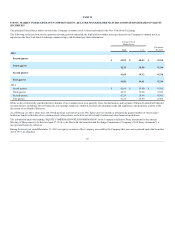
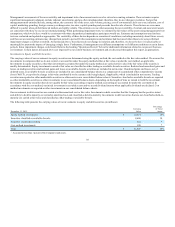
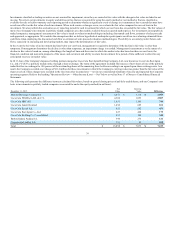
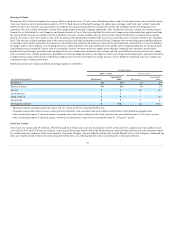
The following table presents the carrying values of our investments in equity and debt securities (in millions):
December 31, 2015
Carrying
Value
Percentage
of Total
Assets
Equity method investments $ 12,318
14%
Securities classified as available-for-sale 8,606
10
Securities classified as trading 322
*
Cost method investments 190
*
Total $ 21,436
24%
* Accounts for less than 1 percent of the Company's total assets.
38