Coca Cola 2015 Annual Report Download - page 144
Download and view the complete annual report
Please find page 144 of the 2015 Coca Cola annual report below. You can navigate through the pages in the report by either clicking on the pages listed below, or by using the keyword search tool below to find specific information within the annual report.-
 1
1 -
2
-
3
-
4
-
5
-
6
-
7
-
8
-
9
-
10
-
11
-
12
-
13
-
14
-
15
-
16
-
17
-
18
-
19
-
20
-
21
-
22
-
23
-
24
-
25
-
26
-
27
-
28
-
29
-
30
-
31
-
32
-
33
-
34
-
35
-
36
-
37
-
38
-
39
-
40
-
41
-
42
-
43
-
44
-
45
-
46
-
47
-
48
-
49
-
50
-
51
-
52
-
53
-
54
-
55
-
56
-
57
-
58
-
59
-
60
-
61
-
62
-
63
-
64
-
65
-
66
-
67
-
68
-
69
-
70
-
71
-
72
-
73
-
74
-
75
-
76
-
77
-
78
-
79
-
80
-
81
-
82
-
83
-
84
-
85
-
86
-
87
-
88
-
89
-
90
-
91
-
92
-
93
-
94
-
95
-
96
-
97
-
98
-
99
-
100
-
101
-
102
-
103
-
104
-
105
-
106
-
107
-
108
-
109
-
110
-
111
-
112
-
113
-
114
-
115
-
116
-
117
-
118
-
119
-
120
-
121
-
122
-
123
-
124
-
125
-
126
-
127
-
128
-
129
-
130
-
131
-
132
-
133
-
 134
134 -
 135
135 -
 136
136 -
 137
137 -
 138
138 -
 139
139 -
 140
140 -
 141
141 -
 142
142 -
 143
143 -
 144
144 -
 145
145 -
 146
146 -
 147
147 -
 148
148 -
 149
149 -
 150
150 -
 151
151 -
 152
152 -
 153
153 -
 154
154 -
155
-
156
-
157
-
158
-
159
-
160
-
161
-
162
-
163
-
164
-
165
-
166
-
167
-
168
-
169
-
170
-
171
-
172
-
173
-
174
-
175
-
176
-
177
-
178
-
179
-
180
-
181
-
182
-
183
-
184
-
185
-
186
-
187
-
188
-
189
-
190
-
191
-
192
-
193
-
194
-
195
-
196
-
197
-
198
-
199
-
200
-
201
-
202
-
203
-
204
-
205
-
206
-
207
-
208
-
209
-
210
-
211
-
212
-
213
-
214
-
215
-
216
-
217
-
218
-
219
-
220
 |
 |
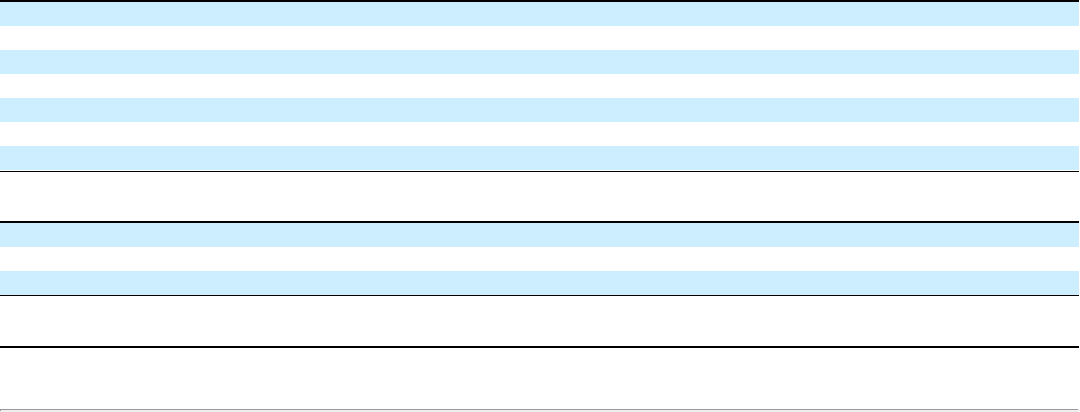
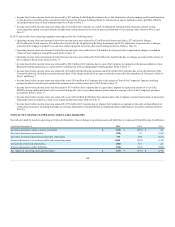
In February 2016, additional territories in North America met the criteria to be classified as held for sale. Therefore, we are required to record the related assets
and liabilities at the lower of carrying value or fair value less any costs to sell based on the estimated sale price, which will result in a noncash loss of $296
million in 2016. This loss is primarily related to the write-down of intangible assets due to the accounting treatment for the contingent consideration that will
be received in exchange for the grant of the exclusive territory rights. The Company expects these territories to be refranchised at various times throughout
2016. Refer to Note 2 for additional information about North America refranchising.
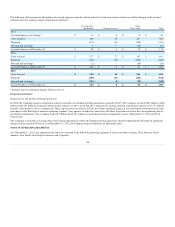
The following table presents information related to the major classes of assets and liabilities related to these additional territories, which were included in the
North America operating segment (in millions):
Inventories $ 4
Prepaid expenses and other assets 1
Property, plant and equipment — net 62
Bottlers' franchise rights with indefinite lives 273
Goodwill 10
Other intangible assets 13
Allowance for reduction of assets held for sale (296)
Total assets $ 67
Accounts payable and accrued expenses $ 1
Other liabilities 1
Deferred income taxes 19
Total liabilities $ 21
141