Coca Cola 2015 Annual Report Download - page 133
Download and view the complete annual report
Please find page 133 of the 2015 Coca Cola annual report below. You can navigate through the pages in the report by either clicking on the pages listed below, or by using the keyword search tool below to find specific information within the annual report.-
 1
1 -
2
-
3
-
4
-
5
-
6
-
7
-
8
-
9
-
10
-
11
-
12
-
13
-
14
-
15
-
16
-
17
-
18
-
19
-
20
-
21
-
22
-
23
-
24
-
25
-
26
-
27
-
28
-
29
-
30
-
31
-
32
-
33
-
34
-
35
-
36
-
37
-
38
-
39
-
40
-
41
-
42
-
43
-
44
-
45
-
46
-
47
-
48
-
49
-
50
-
51
-
52
-
53
-
54
-
55
-
56
-
57
-
58
-
59
-
60
-
61
-
62
-
63
-
64
-
65
-
66
-
67
-
68
-
69
-
70
-
71
-
72
-
73
-
74
-
75
-
76
-
77
-
78
-
79
-
80
-
81
-
82
-
83
-
84
-
85
-
86
-
87
-
88
-
89
-
90
-
91
-
92
-
93
-
94
-
95
-
96
-
97
-
98
-
99
-
100
-
101
-
102
-
103
-
104
-
105
-
106
-
107
-
108
-
109
-
110
-
111
-
112
-
113
-
114
-
115
-
116
-
117
-
118
-
119
-
120
-
121
-
122
-
 123
123 -
 124
124 -
 125
125 -
 126
126 -
 127
127 -
 128
128 -
 129
129 -
 130
130 -
 131
131 -
 132
132 -
 133
133 -
 134
134 -
 135
135 -
 136
136 -
 137
137 -
 138
138 -
 139
139 -
 140
140 -
 141
141 -
 142
142 -
 143
143 -
144
-
145
-
146
-
147
-
148
-
149
-
150
-
151
-
152
-
153
-
154
-
155
-
156
-
157
-
158
-
159
-
160
-
161
-
162
-
163
-
164
-
165
-
166
-
167
-
168
-
169
-
170
-
171
-
172
-
173
-
174
-
175
-
176
-
177
-
178
-
179
-
180
-
181
-
182
-
183
-
184
-
185
-
186
-
187
-
188
-
189
-
190
-
191
-
192
-
193
-
194
-
195
-
196
-
197
-
198
-
199
-
200
-
201
-
202
-
203
-
204
-
205
-
206
-
207
-
208
-
209
-
210
-
211
-
212
-
213
-
214
-
215
-
216
-
217
-
218
-
219
-
220
 |
 |

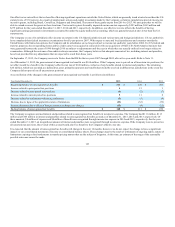
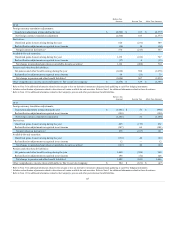
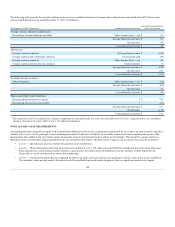
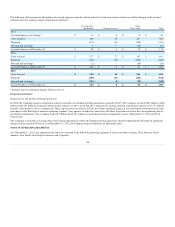
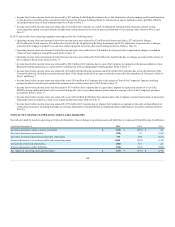
The gains or losses on assets measured at fair value on a nonrecurring basis are summarized in the table below (in millions):
Gains (Losses)
December 31, 2014
Assets held for sale1
$ (494)
Intangible assets (18) 2
Investment in formerly unconsolidated subsidiary —
Valuation of shares in equity method investee (32) 4
Total $ (544)
1 The Company is required to record assets and liabilities that are held for sale at the lower of carrying value or fair value less any costs to sell based on the agreed-upon sale price.
These charges primarily related to refranchising activities in North America. The charges were calculated based on Level 3 inputs. Refer to Note 2.
2 The Company recognized losses of $473 million and $18 million during the years ended December 31, 2015 and 2014, respectively, due to impairment charges on certain
intangible assets. The charges incurred during 2015 included $418 million of impairment charges primarily due to the discontinuation of the energy products in the glacéau
portfolio as a result of the Monster Transaction and a $55 million impairment charge on a Venezuelan trademark. The charges were determined by comparing the fair value of the
assets to the current carrying value. The fair value of the assets was derived using discounted cash flow analyses based on Level 3 inputs. Refer to Note 1, Note 2 and Note 17.
3 The Company recognized a loss of $19 million on our previously held investment in a South African bottler, which had been accounted for under the equity method of
accounting prior to our acquisition of the bottler in February 2015. U.S. GAAP requires the acquirer to remeasure its previously held noncontrolling equity interest in the
acquired entity to fair value as of the acquisition date and recognize any gains or losses in earnings. The Company remeasured our equity interest in the South African bottler
based on Level 3 inputs. Refer to Note 2.
4 In 2014, the Company recognized an estimated loss of $32 million as a result of the owners of the majority interest in a Brazilian bottling entity exercising their option to acquire
from us a 10 percent interest in the entity's outstanding shares. The exercise price was lower than our carrying value. The transaction closed in January 2015, and the Company
recorded an additional loss of $6 million during the year ended December 31, 2015, calculated based on the final option price. These losses were determined using Level 3 inputs.
Refer to Note 2 and Note 17.
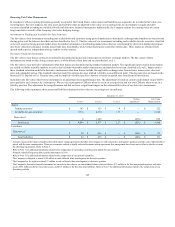
Fair Value Measurements for Pension and Other Postretirement Benefit Plans
The fair value hierarchy discussed above is not only applicable to assets and liabilities that are included in our consolidated balance sheets but is also
applied to certain other assets that indirectly impact our consolidated financial statements. For example, our Company sponsors and/or contributes to a
number of pension and other postretirement benefit plans. Assets contributed by the Company become the property of the individual plans. Even though the
Company no longer has control over these assets, we are indirectly impacted by subsequent fair value adjustments to these assets. The actual return on these
assets impacts the Company's future net periodic benefit cost, as well as amounts recognized in our consolidated balance sheets. Refer to Note 13. The
Company uses the fair value hierarchy to measure the fair value of assets held by our various pension and other postretirement benefit plans.
131