Coca Cola 2015 Annual Report Download - page 35
Download and view the complete annual report
Please find page 35 of the 2015 Coca Cola annual report below. You can navigate through the pages in the report by either clicking on the pages listed below, or by using the keyword search tool below to find specific information within the annual report.-
 1
1 -
2
-
3
-
4
-
5
-
6
-
7
-
8
-
9
-
10
-
11
-
12
-
13
-
14
-
15
-
16
-
17
-
18
-
19
-
20
-
21
-
22
-
23
-
24
-
 25
25 -
 26
26 -
 27
27 -
 28
28 -
 29
29 -
 30
30 -
 31
31 -
 32
32 -
 33
33 -
 34
34 -
 35
35 -
 36
36 -
 37
37 -
 38
38 -
 39
39 -
 40
40 -
 41
41 -
 42
42 -
 43
43 -
 44
44 -
 45
45 -
46
-
47
-
48
-
49
-
50
-
51
-
52
-
53
-
54
-
55
-
56
-
57
-
58
-
59
-
60
-
61
-
62
-
63
-
64
-
65
-
66
-
67
-
68
-
69
-
70
-
71
-
72
-
73
-
74
-
75
-
76
-
77
-
78
-
79
-
80
-
81
-
82
-
83
-
84
-
85
-
86
-
87
-
88
-
89
-
90
-
91
-
92
-
93
-
94
-
95
-
96
-
97
-
98
-
99
-
100
-
101
-
102
-
103
-
104
-
105
-
106
-
107
-
108
-
109
-
110
-
111
-
112
-
113
-
114
-
115
-
116
-
117
-
118
-
119
-
120
-
121
-
122
-
123
-
124
-
125
-
126
-
127
-
128
-
129
-
130
-
131
-
132
-
133
-
134
-
135
-
136
-
137
-
138
-
139
-
140
-
141
-
142
-
143
-
144
-
145
-
146
-
147
-
148
-
149
-
150
-
151
-
152
-
153
-
154
-
155
-
156
-
157
-
158
-
159
-
160
-
161
-
162
-
163
-
164
-
165
-
166
-
167
-
168
-
169
-
170
-
171
-
172
-
173
-
174
-
175
-
176
-
177
-
178
-
179
-
180
-
181
-
182
-
183
-
184
-
185
-
186
-
187
-
188
-
189
-
190
-
191
-
192
-
193
-
194
-
195
-
196
-
197
-
198
-
199
-
200
-
201
-
202
-
203
-
204
-
205
-
206
-
207
-
208
-
209
-
210
-
211
-
212
-
213
-
214
-
215
-
216
-
217
-
218
-
219
-
220
 |
 |
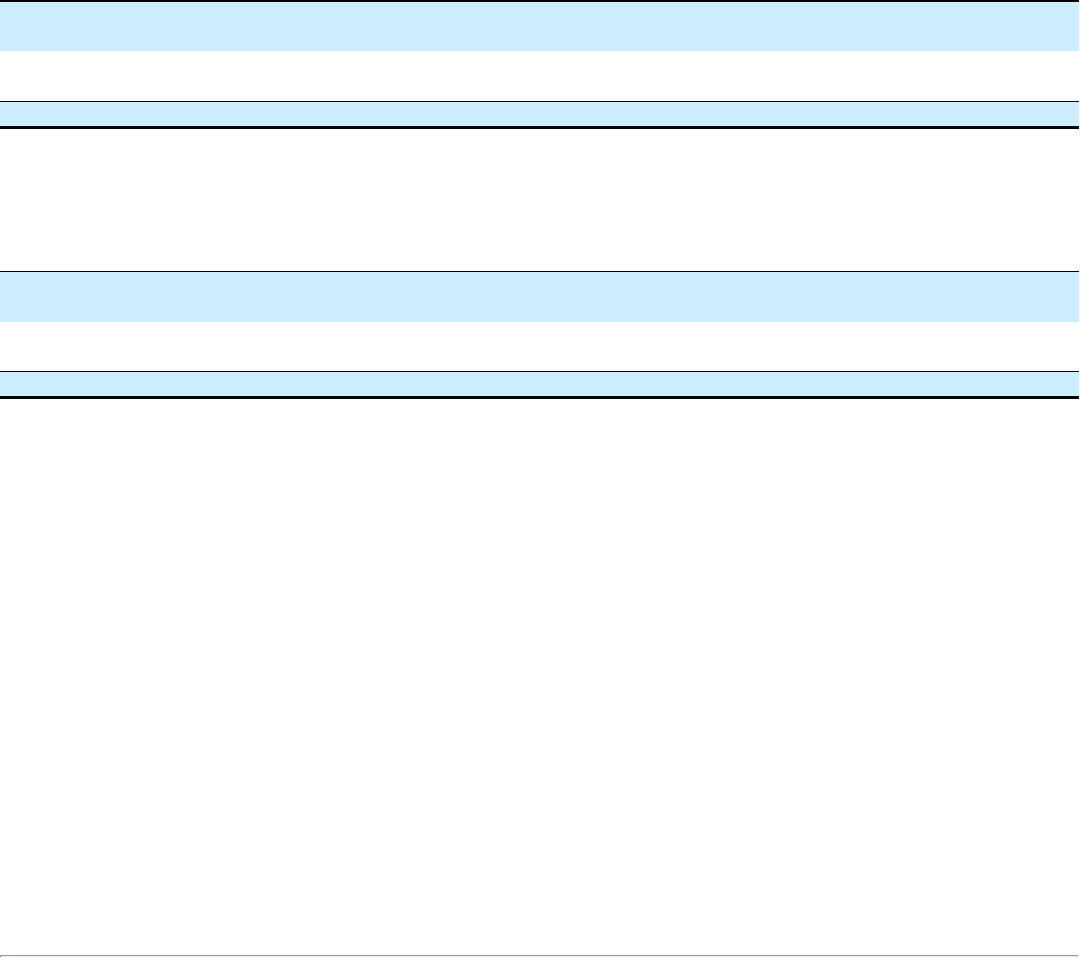
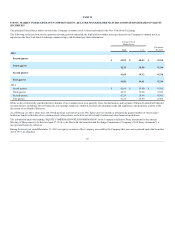
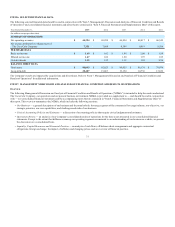
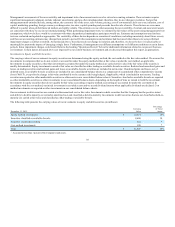
The following table sets forth the percentage of total net operating revenues related to concentrate operations and finished product operations:
Year Ended December 31, 2014 2013
Concentrate operations1
38% 38%
Finished product operations2
62 62
Total 100% 100%
1 Includes concentrates sold by the Company to authorized bottling partners for the manufacture of fountain syrups. The bottlers then typically sell the fountain syrups to
wholesalers or directly to fountain retailers.
2 Includes fountain syrups manufactured by the Company, including consolidated bottling operations, and sold to fountain retailers or to authorized fountain wholesalers or
bottling partners who resell the fountain syrups to fountain retailers.
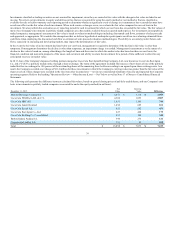
The following table sets forth the percentage of total worldwide unit case volume related to concentrate operations and finished product operations:
Year Ended December 31, 2014 2013
Concentrate operations1
73% 72%
Finished product operations2
27 28
Total 100% 100%
1 Includes unit case volume related to concentrates sold by the Company to authorized bottling partners for the manufacture of fountain syrups. The bottlers then typically sell the
fountain syrups to wholesalers or directly to fountain retailers.
2 Includes unit case volume related to fountain syrups manufactured by the Company, including consolidated bottling operations, and sold to fountain retailers or to authorized
fountain wholesalers or bottling partners who resell the fountain syrups to fountain retailers.
The Nonalcoholic Beverage Segment of the Commercial Beverage Industry
We operate in the highly competitive nonalcoholic beverage segment of the commercial beverage industry. We face strong competition from numerous other
general and specialty beverage companies. We, along with other beverage companies, are affected by a number of factors, including, but not limited to, cost
to manufacture and distribute products, consumer spending, economic conditions, availability and quality of water, consumer preferences, inflation, political
climate, local and national laws and regulations, foreign currency fluctuations, fuel prices and weather patterns.
Our Objective
Our objective is to use our formidable assets — our brands, financial strength, unrivaled distribution system, global reach, and the talent and strong
commitment of our management and associates — to achieve long-term sustainable growth. Our vision for sustainable growth includes the following:
• People: Being a great place to work where people are inspired to be the best they can be.
• Portfolio: Bringing to the world a portfolio of beverage brands that anticipates and satisfies people's desires and needs.
• Partners: Nurturing a winning network of partners and building mutual loyalty.
• Planet: Being a responsible global citizen that makes a difference.
• Profit: Maximizing return to shareowners while being mindful of our overall responsibilities.
• Productivity: Managing our people, time and money for greatest effectiveness.
To enable us to achieve our objective, we must further enhance our core capabilities of consumer marketing; commercial leadership; franchise leadership;
and bottling and distribution operations.
33