Coca Cola 2015 Annual Report Download - page 85
Download and view the complete annual report
Please find page 85 of the 2015 Coca Cola annual report below. You can navigate through the pages in the report by either clicking on the pages listed below, or by using the keyword search tool below to find specific information within the annual report.-
 1
1 -
2
-
3
-
4
-
5
-
6
-
7
-
8
-
9
-
10
-
11
-
12
-
13
-
14
-
15
-
16
-
17
-
18
-
19
-
20
-
21
-
22
-
23
-
24
-
25
-
26
-
27
-
28
-
29
-
30
-
31
-
32
-
33
-
34
-
35
-
36
-
37
-
38
-
39
-
40
-
41
-
42
-
43
-
44
-
45
-
46
-
47
-
48
-
49
-
50
-
51
-
52
-
53
-
54
-
55
-
56
-
57
-
58
-
59
-
60
-
61
-
62
-
63
-
64
-
65
-
66
-
67
-
68
-
69
-
70
-
71
-
72
-
73
-
74
-
 75
75 -
 76
76 -
 77
77 -
 78
78 -
 79
79 -
 80
80 -
 81
81 -
 82
82 -
 83
83 -
 84
84 -
 85
85 -
 86
86 -
 87
87 -
 88
88 -
 89
89 -
 90
90 -
 91
91 -
 92
92 -
 93
93 -
 94
94 -
 95
95 -
96
-
97
-
98
-
99
-
100
-
101
-
102
-
103
-
104
-
105
-
106
-
107
-
108
-
109
-
110
-
111
-
112
-
113
-
114
-
115
-
116
-
117
-
118
-
119
-
120
-
121
-
122
-
123
-
124
-
125
-
126
-
127
-
128
-
129
-
130
-
131
-
132
-
133
-
134
-
135
-
136
-
137
-
138
-
139
-
140
-
141
-
142
-
143
-
144
-
145
-
146
-
147
-
148
-
149
-
150
-
151
-
152
-
153
-
154
-
155
-
156
-
157
-
158
-
159
-
160
-
161
-
162
-
163
-
164
-
165
-
166
-
167
-
168
-
169
-
170
-
171
-
172
-
173
-
174
-
175
-
176
-
177
-
178
-
179
-
180
-
181
-
182
-
183
-
184
-
185
-
186
-
187
-
188
-
189
-
190
-
191
-
192
-
193
-
194
-
195
-
196
-
197
-
198
-
199
-
200
-
201
-
202
-
203
-
204
-
205
-
206
-
207
-
208
-
209
-
210
-
211
-
212
-
213
-
214
-
215
-
216
-
217
-
218
-
219
-
220
 |
 |

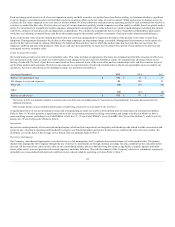
Shipping and Handling Costs
Shipping and handling costs related to the movement of finished goods from manufacturing locations to our sales distribution centers are included in the line
item cost of goods sold in our consolidated statements of income. Shipping and handling costs incurred to move finished goods from our sales distribution
centers to customer locations are included in the line item selling, general and administrative expenses in our consolidated statements of income. During the
years ended December 31, 2015, 2014 and 2013, the Company recorded shipping and handling costs of $2.5 billion, $2.7 billion and $2.7 billion,
respectively, in the line item selling, general and administrative expenses. Our customers do not pay us separately for shipping and handling costs related to
finished goods.
Net Income Per Share
Basic net income per share is computed by dividing net income by the weighted-average number of common shares outstanding during the reporting period.
Diluted net income per share is computed similarly to basic net income per share, except that it includes the potential dilution that could occur if dilutive
securities were exercised. Approximately 27 million, 38 million and 28 million stock option awards were excluded from the computations of diluted net
income per share in 2015, 2014 and 2013, respectively, because the awards would have been antidilutive for the years presented.
Cash Equivalents
We classify time deposits and other investments that are highly liquid and have maturities of three months or less at the date of purchase as cash equivalents.
We manage our exposure to counterparty credit risk through specific minimum credit standards, diversification of counterparties and procedures to monitor
our credit risk concentrations.
Short-Term Investments
We classify time deposits and other investments that have maturities of greater than three months but less than one year as short-term investments.
Investments in Equity and Debt Securities
We use the equity method to account for our investments in equity securities if our investment gives us the ability to exercise significant influence over
operating and financial policies of the investee. We include our proportionate share of earnings and/or losses of our equity method investees in equity
income (loss) — net in our consolidated statements of income. The carrying value of our equity investments is reported in equity method investments in our
consolidated balance sheets. Refer to Note 6.
We account for investments in companies that we do not control or account for under the equity method either at fair value or under the cost method, as
applicable. Investments in equity securities, other than investments accounted for under the equity method, are carried at fair value if the fair value of the
security is readily determinable. Equity investments carried at fair value are classified as either trading or available-for-sale securities with their cost basis
determined by the specific identification method. Realized and unrealized gains and losses on trading securities and realized gains and losses on available-
for-sale securities are included in other income (loss) — net in our consolidated statements of income. Unrealized gains and losses, net of deferred taxes, on
available-for-sale securities are included in our consolidated balance sheets as a component of accumulated other comprehensive income (loss) ("AOCI"),
except for the change in fair value attributable to the currency risk being hedged, if applicable, which is included in other income (loss) — net in our
consolidated statements of income. Trading securities are reported as either marketable securities or other assets in our consolidated balance sheets. Securities
classified as available-for-sale are reported as either marketable securities, other investments or other assets in our consolidated balance sheets, depending on
the length of time we intend to hold the investment. Refer to Note 3.
Investments in equity securities that we do not control or account for under the equity method and do not have readily determinable fair values for are
accounted for under the cost method. Cost method investments are originally recorded at cost, and we record dividend income when applicable dividends are
declared. Cost method investments are reported as other investments in our consolidated balance sheets, and dividend income from cost method investments
is reported in the line item other income (loss) — net in our consolidated statements of income.
Our investments in debt securities are carried at either amortized cost or fair value. Investments in debt securities that the Company has the positive intent
and ability to hold to maturity are carried at amortized cost and classified as held-to-maturity. Investments in debt securities that are not classified as held-to-
maturity are carried at fair value and classified as either trading or available-for-sale.
83