Coca Cola 2015 Annual Report Download - page 66
Download and view the complete annual report
Please find page 66 of the 2015 Coca Cola annual report below. You can navigate through the pages in the report by either clicking on the pages listed below, or by using the keyword search tool below to find specific information within the annual report.-
 1
1 -
2
-
3
-
4
-
5
-
6
-
7
-
8
-
9
-
10
-
11
-
12
-
13
-
14
-
15
-
16
-
17
-
18
-
19
-
20
-
21
-
22
-
23
-
24
-
25
-
26
-
27
-
28
-
29
-
30
-
31
-
32
-
33
-
34
-
35
-
36
-
37
-
38
-
39
-
40
-
41
-
42
-
43
-
44
-
45
-
46
-
47
-
48
-
49
-
50
-
51
-
52
-
53
-
54
-
55
-
 56
56 -
 57
57 -
 58
58 -
 59
59 -
 60
60 -
 61
61 -
 62
62 -
 63
63 -
 64
64 -
 65
65 -
 66
66 -
 67
67 -
 68
68 -
 69
69 -
 70
70 -
 71
71 -
 72
72 -
 73
73 -
 74
74 -
 75
75 -
 76
76 -
77
-
78
-
79
-
80
-
81
-
82
-
83
-
84
-
85
-
86
-
87
-
88
-
89
-
90
-
91
-
92
-
93
-
94
-
95
-
96
-
97
-
98
-
99
-
100
-
101
-
102
-
103
-
104
-
105
-
106
-
107
-
108
-
109
-
110
-
111
-
112
-
113
-
114
-
115
-
116
-
117
-
118
-
119
-
120
-
121
-
122
-
123
-
124
-
125
-
126
-
127
-
128
-
129
-
130
-
131
-
132
-
133
-
134
-
135
-
136
-
137
-
138
-
139
-
140
-
141
-
142
-
143
-
144
-
145
-
146
-
147
-
148
-
149
-
150
-
151
-
152
-
153
-
154
-
155
-
156
-
157
-
158
-
159
-
160
-
161
-
162
-
163
-
164
-
165
-
166
-
167
-
168
-
169
-
170
-
171
-
172
-
173
-
174
-
175
-
176
-
177
-
178
-
179
-
180
-
181
-
182
-
183
-
184
-
185
-
186
-
187
-
188
-
189
-
190
-
191
-
192
-
193
-
194
-
195
-
196
-
197
-
198
-
199
-
200
-
201
-
202
-
203
-
204
-
205
-
206
-
207
-
208
-
209
-
210
-
211
-
212
-
213
-
214
-
215
-
216
-
217
-
218
-
219
-
220
 |
 |

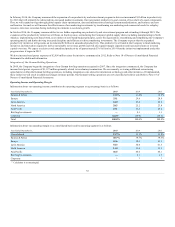
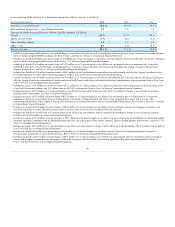
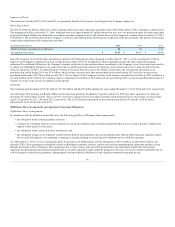
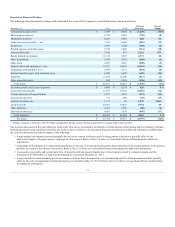
Total capital expenditures for property, plant and equipment and the percentage of such totals by operating segment were as follows (in millions):
Year Ended December 31,
2014
2013
Capital expenditures
$ 2,406
$ 2,550
Eurasia & Africa
1.3%
1.6%
Europe
2.2
1.3
Latin America
2.3
2.5
North America
53.7
53.9
Asia Pacific
3.2
4.6
Bottling Investments
26.1
25.2
Corporate
11.2
10.9
We expect our annual 2016 capital expenditures to be $2.5 billion to $3.0 billion as we continue to make investments to enable growth in our business and
further enhance our operational effectiveness.
Other Investing Activities
In 2015, cash used in other investing activities included a $530 million payment related to the Monster Transaction, partially offset by the cash flow impact
of the Company's derivative contracts designated as net investment hedges. Refer to Note 2 of Notes to Consolidated Financial Statements for additional
information on the Monster Transaction and Note 5 of Notes to Consolidated Financial Statements for additional information on the Company's derivative
contracts designated as net investment hedges.
In 2014, other investing activities were primarily related to loans to Fairlife, LLC, a value-added dairy joint venture, as well as local investments in
Argentina.
In 2013, other investing activities were primarily related to the acquisition of trademarks and certain other intangible assets. None of these investments was
individually significant.
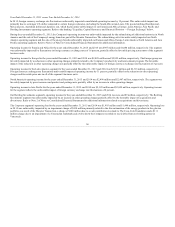
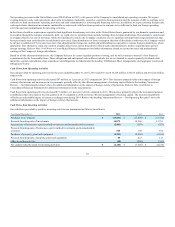
Cash Flows from Financing Activities
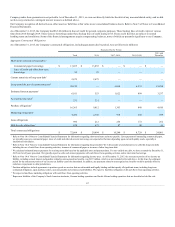
Our cash flows provided by (used in) financing activities were as follows (in millions):
Year Ended December 31,
2014
2013
Issuances of debt
$ 41,674
$ 43,425
Payments of debt
(36,962)
(38,714)
Issuances of stock
1,532
1,328
Purchases of stock for treasury
(4,162)
(4,832)
Dividends
(5,350)
(4,969)
Other financing activities
(363)
17
Net cash provided by (used in) financing activities
$ (3,631)
$ (3,745)
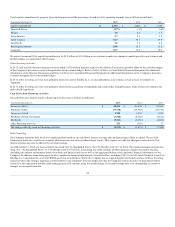
Debt Financing
Our Company maintains debt levels we consider prudent based on our cash flows, interest coverage ratio and percentage of debt to capital. We use debt
financing to lower our overall cost of capital, which increases our return on shareowners' equity. This exposes us to adverse changes in interest rates. Our
interest expense may also be affected by our credit ratings.
As of December 31, 2015, our long-term debt was rated "AA" by Standard & Poor's, "Aa3" by Moody's and "A+" by Fitch. Our commercial paper program was
rated "A-1+" by Standard & Poor's, "P-1" by Moody's and "F1" by Fitch. In assessing our credit strength, all three agencies consider our capital structure
(including the amount and maturity dates of our debt) and financial policies as well as the aggregated balance sheet and other financial information of the
Company. In addition, some rating agencies also consider the financial information of certain bottlers, including CCE, Coca-Cola Amatil Limited, Coca-Cola
Bottling Co. Consolidated, Coca-Cola FEMSA and Coca-Cola Hellenic. While the Company has no legal obligation for the debt of these bottlers, the rating
agencies believe the strategic importance of the bottlers to the Company's business model provides the Company with an incentive to keep these bottlers
viable. It is our expectation that the credit rating agencies will continue using this methodology. If our credit ratings were to be downgraded as a result of
changes in our capital structure,
64