Coca Cola 2015 Annual Report Download - page 98
Download and view the complete annual report
Please find page 98 of the 2015 Coca Cola annual report below. You can navigate through the pages in the report by either clicking on the pages listed below, or by using the keyword search tool below to find specific information within the annual report.-
 1
1 -
2
-
3
-
4
-
5
-
6
-
7
-
8
-
9
-
10
-
11
-
12
-
13
-
14
-
15
-
16
-
17
-
18
-
19
-
20
-
21
-
22
-
23
-
24
-
25
-
26
-
27
-
28
-
29
-
30
-
31
-
32
-
33
-
34
-
35
-
36
-
37
-
38
-
39
-
40
-
41
-
42
-
43
-
44
-
45
-
46
-
47
-
48
-
49
-
50
-
51
-
52
-
53
-
54
-
55
-
56
-
57
-
58
-
59
-
60
-
61
-
62
-
63
-
64
-
65
-
66
-
67
-
68
-
69
-
70
-
71
-
72
-
73
-
74
-
75
-
76
-
77
-
78
-
79
-
80
-
81
-
82
-
83
-
84
-
85
-
86
-
87
-
 88
88 -
 89
89 -
 90
90 -
 91
91 -
 92
92 -
 93
93 -
 94
94 -
 95
95 -
 96
96 -
 97
97 -
 98
98 -
 99
99 -
 100
100 -
 101
101 -
 102
102 -
 103
103 -
 104
104 -
 105
105 -
 106
106 -
 107
107 -
 108
108 -
109
-
110
-
111
-
112
-
113
-
114
-
115
-
116
-
117
-
118
-
119
-
120
-
121
-
122
-
123
-
124
-
125
-
126
-
127
-
128
-
129
-
130
-
131
-
132
-
133
-
134
-
135
-
136
-
137
-
138
-
139
-
140
-
141
-
142
-
143
-
144
-
145
-
146
-
147
-
148
-
149
-
150
-
151
-
152
-
153
-
154
-
155
-
156
-
157
-
158
-
159
-
160
-
161
-
162
-
163
-
164
-
165
-
166
-
167
-
168
-
169
-
170
-
171
-
172
-
173
-
174
-
175
-
176
-
177
-
178
-
179
-
180
-
181
-
182
-
183
-
184
-
185
-
186
-
187
-
188
-
189
-
190
-
191
-
192
-
193
-
194
-
195
-
196
-
197
-
198
-
199
-
200
-
201
-
202
-
203
-
204
-
205
-
206
-
207
-
208
-
209
-
210
-
211
-
212
-
213
-
214
-
215
-
216
-
217
-
218
-
219
-
220
 |
 |

In 2015 and 2014, the Company had investments classified as available-for-sale securities in which our cost basis exceeded the fair value of our investment.
Management assessed each of these investments on an individual basis to determine if the decline in fair value was other than temporary. Management's
assessment as to the nature of a decline in fair value is based on, among other things, the length of time and the extent to which the market value has been less
than our cost basis; the financial condition and near-term prospects of the issuer; and our intent and ability to retain the investment for a period of time
sufficient to allow for any anticipated recovery in market value. As a result of these assessments, management determined that the decline in fair value of
these investments was not other than temporary and did not record any impairment charges.
The Company uses insurance captives to reinsure group annuity insurance contracts that cover the pension obligations of certain of our European and
Canadian pension plans. In accordance with local insurance regulations, our insurance captive is required to meet and maintain minimum solvency capital
requirements. The Company elected to invest its solvency capital in a portfolio of available-for-sale securities, which have been classified in the line item
other assets in our consolidated balance sheets because the assets are not available to satisfy our current obligations. As of December 31, 2015 and 2014, the
Company's available-for-sale securities included solvency capital funds of $804 million and $836 million, respectively.
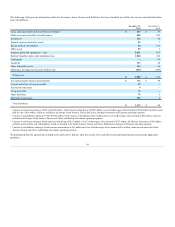
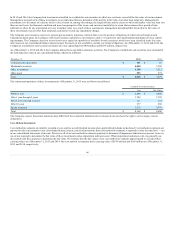
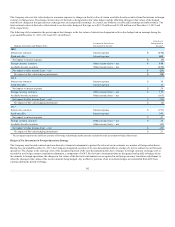
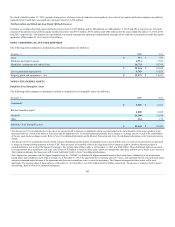
As of December 31, 2015 and 2014, the Company did not have any held-to-maturity securities. The Company's available-for-sale securities were included in
the following line items in our consolidated balance sheets (in millions):
December 31,
2014
Cash and cash equivalents
$ 43
Marketable securities
3,350
Other investments
3,512
Other assets
974
Total
$ 7,879
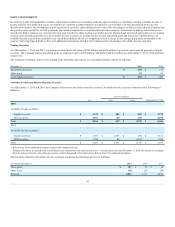
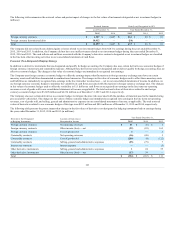
The contractual maturities of these investments as of December 31, 2015 were as follows (in millions):
Available-for-Sale Securities
Cost
Fair Value
Within 1 year $ 2,496
$ 2,496
After 1 year through 5 years 1,709
1,728
After 5 years through 10 years 111
122
After 10 years 277
286
Equity securities 3,573
3,974
Total $ 8,166
$ 8,606
The Company expects that actual maturities may differ from the contractual maturities above because borrowers have the right to call or prepay certain
obligations.
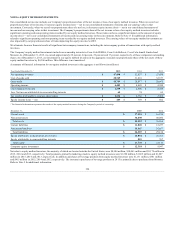
Cost Method Investments
Cost method investments are initially recorded at cost, and we record dividend income when applicable dividends are declared. Cost method investments are
reported as other investments in our consolidated balance sheets, and dividend income from cost method investments is reported in other income (loss) — net
in our consolidated statements of income. We review all of our cost method investments quarterly to determine if impairment indicators are present; however,
we are not required to determine the fair value of these investments unless impairment indicators exist. When impairment indicators exist, we generally use
discounted cash flow analyses to determine the fair value. We estimate that the fair values of our cost method investments approximated or exceeded their
carrying values as of December 31, 2015 and 2014. Our cost method investments had a carrying value of $190 million and $166 million as of December 31,
2015 and 2014, respectively.
96