Coca Cola 2015 Annual Report Download - page 71
Download and view the complete annual report
Please find page 71 of the 2015 Coca Cola annual report below. You can navigate through the pages in the report by either clicking on the pages listed below, or by using the keyword search tool below to find specific information within the annual report.-
 1
1 -
2
-
3
-
4
-
5
-
6
-
7
-
8
-
9
-
10
-
11
-
12
-
13
-
14
-
15
-
16
-
17
-
18
-
19
-
20
-
21
-
22
-
23
-
24
-
25
-
26
-
27
-
28
-
29
-
30
-
31
-
32
-
33
-
34
-
35
-
36
-
37
-
38
-
39
-
40
-
41
-
42
-
43
-
44
-
45
-
46
-
47
-
48
-
49
-
50
-
51
-
52
-
53
-
54
-
55
-
56
-
57
-
58
-
59
-
60
-
 61
61 -
 62
62 -
 63
63 -
 64
64 -
 65
65 -
 66
66 -
 67
67 -
 68
68 -
 69
69 -
 70
70 -
 71
71 -
 72
72 -
 73
73 -
 74
74 -
 75
75 -
 76
76 -
 77
77 -
 78
78 -
 79
79 -
 80
80 -
 81
81 -
82
-
83
-
84
-
85
-
86
-
87
-
88
-
89
-
90
-
91
-
92
-
93
-
94
-
95
-
96
-
97
-
98
-
99
-
100
-
101
-
102
-
103
-
104
-
105
-
106
-
107
-
108
-
109
-
110
-
111
-
112
-
113
-
114
-
115
-
116
-
117
-
118
-
119
-
120
-
121
-
122
-
123
-
124
-
125
-
126
-
127
-
128
-
129
-
130
-
131
-
132
-
133
-
134
-
135
-
136
-
137
-
138
-
139
-
140
-
141
-
142
-
143
-
144
-
145
-
146
-
147
-
148
-
149
-
150
-
151
-
152
-
153
-
154
-
155
-
156
-
157
-
158
-
159
-
160
-
161
-
162
-
163
-
164
-
165
-
166
-
167
-
168
-
169
-
170
-
171
-
172
-
173
-
174
-
175
-
176
-
177
-
178
-
179
-
180
-
181
-
182
-
183
-
184
-
185
-
186
-
187
-
188
-
189
-
190
-
191
-
192
-
193
-
194
-
195
-
196
-
197
-
198
-
199
-
200
-
201
-
202
-
203
-
204
-
205
-
206
-
207
-
208
-
209
-
210
-
211
-
212
-
213
-
214
-
215
-
216
-
217
-
218
-
219
-
220
 |
 |

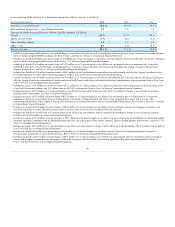
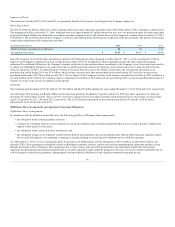
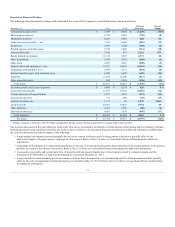
In 2015, we used 72 functional currencies. Due to the geographic diversity of our operations, weakness in some of these currencies might be offset by strength
in others. In 2015, 2014 and 2013, the weighted-average exchange rates for foreign currencies in which the Company conducted operations (all operating
currencies), and for certain individual currencies, strengthened (weakened) against the U.S. dollar as follows:
Year Ended December 31,
2014
2013
All operating currencies
(5)%
(5)%
Brazilian real
(10)%
(9)%
Mexican peso
(4)
4
Australian dollar
(7)
(6)
South African rand
(12)
(13)
British pound
6
(2)
Euro
1
3
Japanese yen
(8)
(18)
These percentages do not include the effects of our hedging activities and, therefore, do not reflect the actual impact of fluctuations in foreign currency
exchange rates on our operating results. Our foreign currency management program is designed to mitigate, over time, a portion of the impact of exchange
rate changes on our net income and earnings per share.
The total currency impacts on net operating revenues, including the effect of our hedging activities, were decreases of 7 percent and 2 percent in 2015 and
2014, respectively. The total currency impacts on income before income taxes, including the effect of our hedging activities, were decreases of 6 percent in
2015 and 9 percent in 2014.
Foreign currency exchange gains and losses are primarily the result of the remeasurement of monetary assets and liabilities from certain currencies into
functional currencies. The effects of the remeasurement of these assets and liabilities are partially offset by the impact of our economic hedging program for
certain exposures on our consolidated balance sheets. Refer to Note 5 of Notes to Consolidated Financial Statements. Foreign currency exchange gains and
losses are included as a component of other income (loss) — net in our consolidated financial statements. Refer to the heading "Operations Review — Other
Income (Loss) — Net" above. The Company recorded foreign currency exchange gains of $149 million in 2015 and foreign currency losses of $569 million
and $162 million in 2014 and 2013, respectively.
Hyperinflationary Economies
A hyperinflationary economy is one that has cumulative inflation of 100 percent or more over a three-year period. In accordance with accounting principles
generally accepted in the United States, local subsidiaries in hyperinflationary economies are required to use the U.S. dollar as their functional currency and
remeasure the monetary assets and liabilities not denominated in U.S. dollars using the rate applicable to conversion of a currency for purposes of dividend
remittances. All exchange gains and losses resulting from remeasurement are recognized currently in income.
Venezuela has been designated as a hyperinflationary economy. In February 2013, the Venezuelan government devalued its currency to an official rate of
exchange ("official rate") of 6.3 bolivars per U.S. dollar. At that time, the Company remeasured the net monetary assets of our Venezuelan subsidiary at the
official rate. As a result of the devaluation, we recognized a loss of $140 million from remeasurement in the line item other income (loss) — net in our
consolidated statement of income.
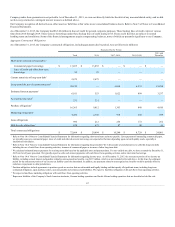
Beginning in the first quarter of 2014, the Venezuelan government recognized three legal exchange rates to convert bolivars to the U.S. dollar: (1) the official
rate of 6.3 bolivars per U.S. dollar; (2) SICAD 1, which was available to foreign investments and designated industry sectors to exchange a limited volume of
bolivars for U.S. dollars using a bid rate established at weekly auctions; and (3) SICAD 2, which applied to transactions that did not qualify for either the
official rate or SICAD 1. As of March 28, 2014, the three legal exchange rates were 6.3 (official rate), 10.8 (SICAD 1) and 50.9 (SICAD 2). We determined that
the SICAD 1 rate was the most appropriate rate to use for remeasurement given our circumstances and estimates of the applicable rate at which future
transactions could be settled, including the payment of dividends. Therefore, as of March 28, 2014, we remeasured the net monetary assets of our Venezuelan
subsidiary using an exchange rate of 10.8 bolivars per U.S. dollar, resulting in a charge of $226 million recorded in the line item other income (loss) — net in
our consolidated statement of income.
69