Coca Cola 2015 Annual Report Download - page 58
Download and view the complete annual report
Please find page 58 of the 2015 Coca Cola annual report below. You can navigate through the pages in the report by either clicking on the pages listed below, or by using the keyword search tool below to find specific information within the annual report.-
 1
1 -
2
-
3
-
4
-
5
-
6
-
7
-
8
-
9
-
10
-
11
-
12
-
13
-
14
-
15
-
16
-
17
-
18
-
19
-
20
-
21
-
22
-
23
-
24
-
25
-
26
-
27
-
28
-
29
-
30
-
31
-
32
-
33
-
34
-
35
-
36
-
37
-
38
-
39
-
40
-
41
-
42
-
43
-
44
-
45
-
46
-
47
-
 48
48 -
 49
49 -
 50
50 -
 51
51 -
 52
52 -
 53
53 -
 54
54 -
 55
55 -
 56
56 -
 57
57 -
 58
58 -
 59
59 -
 60
60 -
 61
61 -
 62
62 -
 63
63 -
 64
64 -
 65
65 -
 66
66 -
 67
67 -
 68
68 -
69
-
70
-
71
-
72
-
73
-
74
-
75
-
76
-
77
-
78
-
79
-
80
-
81
-
82
-
83
-
84
-
85
-
86
-
87
-
88
-
89
-
90
-
91
-
92
-
93
-
94
-
95
-
96
-
97
-
98
-
99
-
100
-
101
-
102
-
103
-
104
-
105
-
106
-
107
-
108
-
109
-
110
-
111
-
112
-
113
-
114
-
115
-
116
-
117
-
118
-
119
-
120
-
121
-
122
-
123
-
124
-
125
-
126
-
127
-
128
-
129
-
130
-
131
-
132
-
133
-
134
-
135
-
136
-
137
-
138
-
139
-
140
-
141
-
142
-
143
-
144
-
145
-
146
-
147
-
148
-
149
-
150
-
151
-
152
-
153
-
154
-
155
-
156
-
157
-
158
-
159
-
160
-
161
-
162
-
163
-
164
-
165
-
166
-
167
-
168
-
169
-
170
-
171
-
172
-
173
-
174
-
175
-
176
-
177
-
178
-
179
-
180
-
181
-
182
-
183
-
184
-
185
-
186
-
187
-
188
-
189
-
190
-
191
-
192
-
193
-
194
-
195
-
196
-
197
-
198
-
199
-
200
-
201
-
202
-
203
-
204
-
205
-
206
-
207
-
208
-
209
-
210
-
211
-
212
-
213
-
214
-
215
-
216
-
217
-
218
-
219
-
220
 |
 |

Year Ended December 31, 2015 versus Year Ended December 31, 2014
In 2015, foreign currency exchange rate fluctuations unfavorably impacted consolidated operating income by 12 percent. This unfavorable impact was
primarily due to a stronger U.S. dollar compared to certain foreign currencies, including the South African rand, euro, U.K. pound sterling, Brazilian real,
Mexican peso, Australian dollar and Japanese yen, which had an unfavorable impact on our Eurasia and Africa, Europe, Latin America, Asia Pacific and
Bottling Investments operating segments. Refer to the heading "Liquidity, Capital Resources and Financial Position — Foreign Exchange" below.
During the year ended December 31, 2015, the Company's operating income was unfavorably impacted by the refranchising of additional territories in North
America and the sale of the Company's energy brands as part of the Monster Transaction. The refranchising activities unfavorably impacted our North
America operating segment and the sale of the energy brands unfavorably impacted our Eurasia and Africa, Europe, Latin America, North America and Asia
Pacific operating segments. Refer to Note 2 of Notes to Consolidated Financial Statements for additional information.
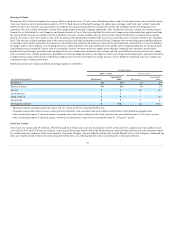
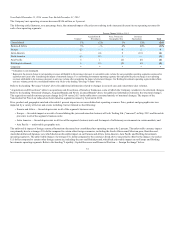
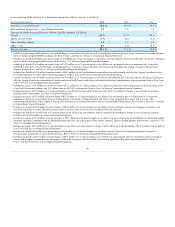
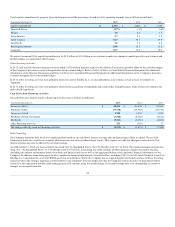
Operating income for Eurasia and Africa for the years ended December 31, 2015 and 2014 was $987 million and $1,084 million, respectively. The segment
was unfavorably impacted by fluctuations in foreign currency exchange rates of 16 percent, partially offset by favorable pricing across most of the segment's
business units.
Operating income for Europe for the years ended December 31, 2015 and 2014 was $2,888 million and $2,852 million, respectively. The Europe group was
favorably impacted by a reduction in other operating charges primarily related to the Company's productivity and reinvestment program. The favorable
impact of the reduction in other operating charges was partially offset by the unfavorable impact of foreign currency exchange rate fluctuations of 3 percent.
Operating income for the Latin America segment for the years ended December 31, 2015 and 2014 was $2,169 million and $2,316 million, respectively.
Foreign currency exchange rate fluctuations unfavorably impacted operating income by 31 percent, partially offset by the reduction in other operating
charges and favorable price mix in all of the segment's business units.
North America's operating income for the years ended December 31, 2015 and 2014 was $2,490 million and $2,447 million, respectively. The segment was
favorably impacted by price increases and product and package mix, partially offset by an increase in other operating charges.
Operating income in Asia Pacific for the years ended December 31, 2015 and 2014 was $2,189 million and $2,448 million, respectively. Operating income
for the segment reflects the unfavorable impact of foreign currency exchange rate fluctuations of 8 percent.
Our Bottling Investments segment's operating income for the years ended December 31, 2015 and 2014 was zero and $9 million, respectively. The Bottling
Investments segment was unfavorably impacted by an increase in other operating charges partially offset by the favorable impact of acquisitions and
divestitures. Refer to Note 2 of Notes to Consolidated Financial Statements for additional information related to acquisitions and divestitures.
The Corporate segment's operating loss for the years ended December 31, 2015 and 2014 was $1,995 million and $1,448 million, respectively. Operating loss
in 2015 was unfavorably impacted by an impairment charge of $418 million primarily related to the discontinuation of the energy products in the glacéau
portfolio as a result of the Monster Transaction, a charge of $100 million due to a cash contribution we made to The Coca-Cola Foundation and a $111
million charge due to an impairment of a Venezuelan trademark and a write-down the Company recorded on receivables from our bottling partner in
Venezuela.
56