Coca Cola 2015 Annual Report Download - page 109
Download and view the complete annual report
Please find page 109 of the 2015 Coca Cola annual report below. You can navigate through the pages in the report by either clicking on the pages listed below, or by using the keyword search tool below to find specific information within the annual report.-
 1
1 -
2
-
3
-
4
-
5
-
6
-
7
-
8
-
9
-
10
-
11
-
12
-
13
-
14
-
15
-
16
-
17
-
18
-
19
-
20
-
21
-
22
-
23
-
24
-
25
-
26
-
27
-
28
-
29
-
30
-
31
-
32
-
33
-
34
-
35
-
36
-
37
-
38
-
39
-
40
-
41
-
42
-
43
-
44
-
45
-
46
-
47
-
48
-
49
-
50
-
51
-
52
-
53
-
54
-
55
-
56
-
57
-
58
-
59
-
60
-
61
-
62
-
63
-
64
-
65
-
66
-
67
-
68
-
69
-
70
-
71
-
72
-
73
-
74
-
75
-
76
-
77
-
78
-
79
-
80
-
81
-
82
-
83
-
84
-
85
-
86
-
87
-
88
-
89
-
90
-
91
-
92
-
93
-
94
-
95
-
96
-
97
-
98
-
 99
99 -
 100
100 -
 101
101 -
 102
102 -
 103
103 -
 104
104 -
 105
105 -
 106
106 -
 107
107 -
 108
108 -
 109
109 -
 110
110 -
 111
111 -
 112
112 -
 113
113 -
 114
114 -
 115
115 -
 116
116 -
 117
117 -
 118
118 -
 119
119 -
120
-
121
-
122
-
123
-
124
-
125
-
126
-
127
-
128
-
129
-
130
-
131
-
132
-
133
-
134
-
135
-
136
-
137
-
138
-
139
-
140
-
141
-
142
-
143
-
144
-
145
-
146
-
147
-
148
-
149
-
150
-
151
-
152
-
153
-
154
-
155
-
156
-
157
-
158
-
159
-
160
-
161
-
162
-
163
-
164
-
165
-
166
-
167
-
168
-
169
-
170
-
171
-
172
-
173
-
174
-
175
-
176
-
177
-
178
-
179
-
180
-
181
-
182
-
183
-
184
-
185
-
186
-
187
-
188
-
189
-
190
-
191
-
192
-
193
-
194
-
195
-
196
-
197
-
198
-
199
-
200
-
201
-
202
-
203
-
204
-
205
-
206
-
207
-
208
-
209
-
210
-
211
-
212
-
213
-
214
-
215
-
216
-
217
-
218
-
219
-
220
 |
 |
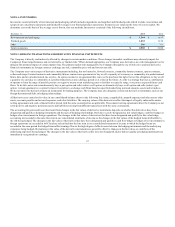
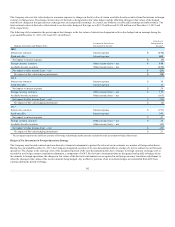
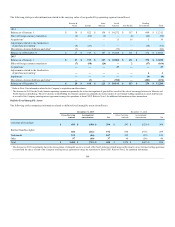
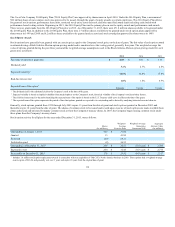
Total amortization expense for intangible assets subject to amortization was $156 million, $168 million and $165 million in 2015, 2014 and 2013,
respectively.
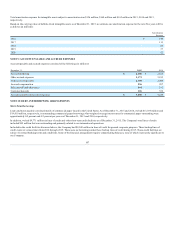
Based on the carrying value of definite-lived intangible assets as of December 31, 2015, we estimate our amortization expense for the next five years will be
as follows (in millions):
Amortization
Expense
2016
$ 149
2017
113
2018
60
2019
57
2020
52
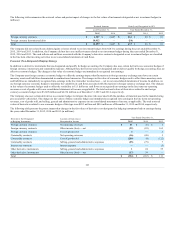
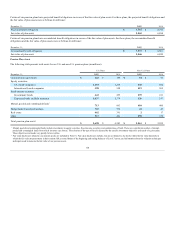
Accounts payable and accrued expenses consisted of the following (in millions):
December 31,
2014
Accrued marketing
$ 2,103
Other accrued expenses
3,182
Trade accounts payable
2,089
Accrued compensation
997
Sales, payroll and other taxes
511
Container deposits
352
Accounts payable and accrued expenses
$ 9,234
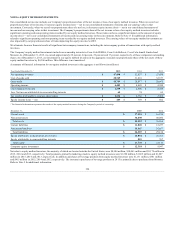
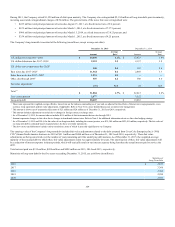
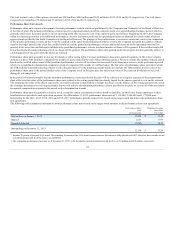
Short-Term Borrowings
Loans and notes payable consist primarily of commercial paper issued in the United States. As of December 31, 2015 and 2014, we had $13,035 million and
$19,010 million, respectively, in outstanding commercial paper borrowings. Our weighted-average interest rates for commercial paper outstanding were
approximately 0.5 percent and 0.2 percent per year as of December 31, 2015 and 2014, respectively.
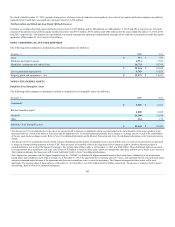
In addition, we had $9,771 million in lines of credit and other short-term credit facilities as of December 31, 2015. The Company's total lines of credit
included $95 million that was outstanding and primarily related to our international operations.
Included in the credit facilities discussed above, the Company had $8,340 million in lines of credit for general corporate purposes. These backup lines of
credit expire at various times from 2016 through 2019. There were no borrowings under these backup lines of credit during 2015. These credit facilities are
subject to normal banking terms and conditions. Some of the financial arrangements require compensating balances, none of which is presently significant to
our Company.
107