Coca Cola 2015 Annual Report Download - page 114
Download and view the complete annual report
Please find page 114 of the 2015 Coca Cola annual report below. You can navigate through the pages in the report by either clicking on the pages listed below, or by using the keyword search tool below to find specific information within the annual report.-
 1
1 -
2
-
3
-
4
-
5
-
6
-
7
-
8
-
9
-
10
-
11
-
12
-
13
-
14
-
15
-
16
-
17
-
18
-
19
-
20
-
21
-
22
-
23
-
24
-
25
-
26
-
27
-
28
-
29
-
30
-
31
-
32
-
33
-
34
-
35
-
36
-
37
-
38
-
39
-
40
-
41
-
42
-
43
-
44
-
45
-
46
-
47
-
48
-
49
-
50
-
51
-
52
-
53
-
54
-
55
-
56
-
57
-
58
-
59
-
60
-
61
-
62
-
63
-
64
-
65
-
66
-
67
-
68
-
69
-
70
-
71
-
72
-
73
-
74
-
75
-
76
-
77
-
78
-
79
-
80
-
81
-
82
-
83
-
84
-
85
-
86
-
87
-
88
-
89
-
90
-
91
-
92
-
93
-
94
-
95
-
96
-
97
-
98
-
99
-
100
-
101
-
102
-
103
-
 104
104 -
 105
105 -
 106
106 -
 107
107 -
 108
108 -
 109
109 -
 110
110 -
 111
111 -
 112
112 -
 113
113 -
 114
114 -
 115
115 -
 116
116 -
 117
117 -
 118
118 -
 119
119 -
 120
120 -
 121
121 -
 122
122 -
 123
123 -
 124
124 -
125
-
126
-
127
-
128
-
129
-
130
-
131
-
132
-
133
-
134
-
135
-
136
-
137
-
138
-
139
-
140
-
141
-
142
-
143
-
144
-
145
-
146
-
147
-
148
-
149
-
150
-
151
-
152
-
153
-
154
-
155
-
156
-
157
-
158
-
159
-
160
-
161
-
162
-
163
-
164
-
165
-
166
-
167
-
168
-
169
-
170
-
171
-
172
-
173
-
174
-
175
-
176
-
177
-
178
-
179
-
180
-
181
-
182
-
183
-
184
-
185
-
186
-
187
-
188
-
189
-
190
-
191
-
192
-
193
-
194
-
195
-
196
-
197
-
198
-
199
-
200
-
201
-
202
-
203
-
204
-
205
-
206
-
207
-
208
-
209
-
210
-
211
-
212
-
213
-
214
-
215
-
216
-
217
-
218
-
219
-
220
 |
 |

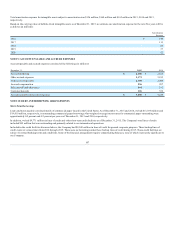
The Coca-Cola Company 2014 Equity Plan ("2014 Equity Plan") was approved by shareowners in April 2014. Under the 2014 Equity Plan, a maximum of
500 million shares of our common stock was approved to be issued, through the grant of equity awards, to certain employees. The 2014 Equity Plan allows
for grants of stock options, performance share units, restricted stock units, restricted stock and other specified award types including cash awards with
performance-based vesting criteria. Beginning in 2015, the 2014 Equity Plan was the primary plan in use for equity awards and performance cash awards.
There were no grants made from the 2014 Equity Plan prior to 2015. As of December 31, 2015, there were 471.6 million shares available to be granted under
the 2014 Equity Plan. In addition to the 2014 Equity Plan, there were 2.7 million shares available to be granted under stock option plans approved by
shareowners in 1999 and 2008 and 0.2 million shares available to be granted under a restricted stock award plan approved by shareowners in 1989.
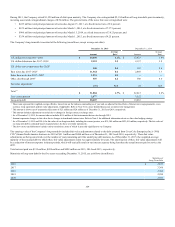
Stock Option Awards
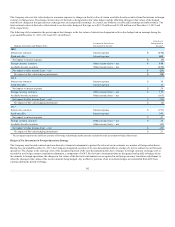
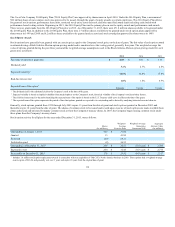
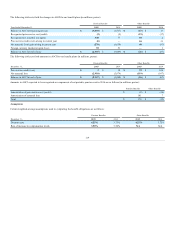
Stock options have generally been granted with an exercise price equal to the Company's stock price on the date of grant. The fair value of each option award
is estimated using a Black-Scholes-Merton option-pricing model and is amortized over the vesting period, generally four years. The weighted-average fair
value of options granted during the past three years and the weighted-average assumptions used in the Black-Scholes-Merton option-pricing model for such
grants were as follows:
2014
2013
Fair value of options at grant date
$ 3.91
$ 3.73
Dividend yield1
2.7%
2.8%
Expected volatility2
16.0%
17.0%
Risk-free interest rate3
1.6%
0.9%
Expected term of the option4
5 years
5 years
1 The dividend yield is the calculated yield on the Company's stock at the time of the grant.
2 Expected volatility is based on implied volatilities from traded options on the Company's stock, historical volatility of the Company's stock and other factors.
3 The risk-free interest rate for the period matching the expected term of the option is based on the U.S. Treasury yield curve in effect at the time of the grant.
4 The expected term of the option represents the period of time that options granted are expected to be outstanding and is derived by analyzing historical exercise behavior.
Generally, stock options granted from 1999 through July 2003 expire 15 years from the date of grant and stock options granted in December 2003 and
thereafter expire 10 years from the date of grant. The shares of common stock to be issued and/or sold upon exercise of stock options are made available from
either authorized and unissued Company common stock or from the Company's treasury shares. In 2007, the Company began issuing common stock under
these plans from the Company's treasury shares.
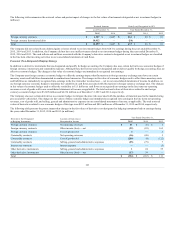
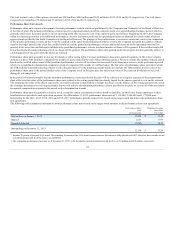
Stock option activity for all plans for the year ended December 31, 2015, was as follows:
Shares
(In millions)
Weighted-
Average
Exercise Price
Weighted-Average
Remaining
Contractual Life
Aggregate
Intrinsic Value
(In millions)
Outstanding on January 1, 2015 305
$ 31.60
Granted 13
41.89
Exercised (44)
28.31
Forfeited/expired (8)
36.53
Outstanding on December 31, 20151266
$ 32.51
5.55 years
$ 2,786
Expected to vest 264
$ 32.45
5.53 years
$ 2,775
Exercisable on December 31, 2015 178
$ 29.92
4.43 years
$ 2,317
1 Includes 1.0 million stock option replacement awards in connection with our acquisition of Old CCE's North America business in 2010. These options had a weighted-average
exercise price of $16.26 and generally vest over 3 years and expire 10 years from the original date of grant.
112