Coca Cola 2015 Annual Report Download - page 127
Download and view the complete annual report
Please find page 127 of the 2015 Coca Cola annual report below. You can navigate through the pages in the report by either clicking on the pages listed below, or by using the keyword search tool below to find specific information within the annual report.-
 1
1 -
2
-
3
-
4
-
5
-
6
-
7
-
8
-
9
-
10
-
11
-
12
-
13
-
14
-
15
-
16
-
17
-
18
-
19
-
20
-
21
-
22
-
23
-
24
-
25
-
26
-
27
-
28
-
29
-
30
-
31
-
32
-
33
-
34
-
35
-
36
-
37
-
38
-
39
-
40
-
41
-
42
-
43
-
44
-
45
-
46
-
47
-
48
-
49
-
50
-
51
-
52
-
53
-
54
-
55
-
56
-
57
-
58
-
59
-
60
-
61
-
62
-
63
-
64
-
65
-
66
-
67
-
68
-
69
-
70
-
71
-
72
-
73
-
74
-
75
-
76
-
77
-
78
-
79
-
80
-
81
-
82
-
83
-
84
-
85
-
86
-
87
-
88
-
89
-
90
-
91
-
92
-
93
-
94
-
95
-
96
-
97
-
98
-
99
-
100
-
101
-
102
-
103
-
104
-
105
-
106
-
107
-
108
-
109
-
110
-
111
-
112
-
113
-
114
-
115
-
116
-
 117
117 -
 118
118 -
 119
119 -
 120
120 -
 121
121 -
 122
122 -
 123
123 -
 124
124 -
 125
125 -
 126
126 -
 127
127 -
 128
128 -
 129
129 -
 130
130 -
 131
131 -
 132
132 -
 133
133 -
 134
134 -
 135
135 -
 136
136 -
 137
137 -
138
-
139
-
140
-
141
-
142
-
143
-
144
-
145
-
146
-
147
-
148
-
149
-
150
-
151
-
152
-
153
-
154
-
155
-
156
-
157
-
158
-
159
-
160
-
161
-
162
-
163
-
164
-
165
-
166
-
167
-
168
-
169
-
170
-
171
-
172
-
173
-
174
-
175
-
176
-
177
-
178
-
179
-
180
-
181
-
182
-
183
-
184
-
185
-
186
-
187
-
188
-
189
-
190
-
191
-
192
-
193
-
194
-
195
-
196
-
197
-
198
-
199
-
200
-
201
-
202
-
203
-
204
-
205
-
206
-
207
-
208
-
209
-
210
-
211
-
212
-
213
-
214
-
215
-
216
-
217
-
218
-
219
-
220
 |
 |

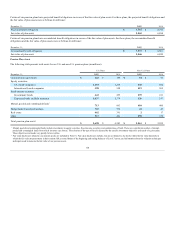
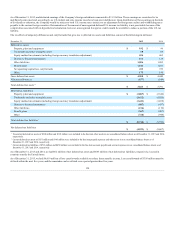
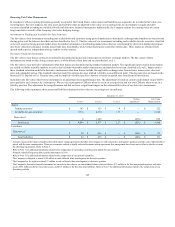
An analysis of our deferred tax asset valuation allowances is as follows (in millions):
Year Ended December 31,
2014
2013
Balance at beginning of year
$ 586
$ 487
Additions
104
169
Decrease due to transfer to assets held for sale
—
—
Deductions
(41)
(70)
Balance at end of year
$ 649
$ 586
The Company's deferred tax asset valuation allowances are primarily the result of uncertainties regarding the future realization of recorded tax benefits on tax
loss carryforwards from operations in various jurisdictions. These valuation allowances were primarily related to deferred tax assets generated from net
operating losses. Current evidence does not suggest we will realize sufficient taxable income of the appropriate character within the carryforward period to
allow us to realize these deferred tax benefits. If we were to identify and implement tax planning strategies to recover these deferred tax assets or generate
sufficient income of the appropriate character in these jurisdictions in the future, it could lead to the reversal of these valuation allowances and a reduction of
income tax expense. The Company believes that it will generate sufficient future taxable income to realize the tax benefits related to the remaining net
deferred tax assets in our consolidated balance sheets.
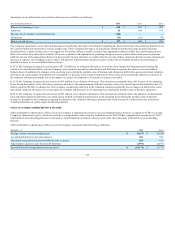
In 2015, the Company recognized a net decrease of $172 million in its valuation allowances. As a result of our German bottling operations meeting the
criteria to be classified as held for sale, the Company was required to present the related assets and liabilities as separate line items in our consolidated
balance sheets. In addition, the changes in net operating losses during the normal course of business and changes in deferred tax assets and related valuation
allowances on certain equity investments also contributed to a decrease in the valuation allowances. These decreases were partially offset by an increase in
the valuation allowances primarily due to the impact of currency devaluations in Venezuela on certain receivables.
In 2014, the Company recognized a net increase of $63 million in its valuation allowances. This increase was primarily due to the increase in net operating
losses during the normal course of business operations and due to the remeasurement of the net monetary assets of our local Venezuelan subsidiary into U.S.
dollars using the SICAD 2 exchange rate. The Company recognized a reduction in the valuation allowances primarily due to changes in deferred tax assets
and related valuation allowances on certain equity investments and decreases in net operating losses during the normal course of business operations.
In 2013, the Company recognized a net increase of $99 million in its valuation allowances. This increase was primarily due to the addition of a deferred tax
asset and related valuation allowance on certain equity method investments and increases in net operating losses during the normal course of business
operations. In addition, the Company recognized a reduction in the valuation allowances primarily due to the reversal of a deferred tax asset and related
valuation allowance on certain equity method investments.
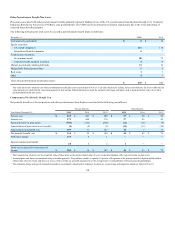
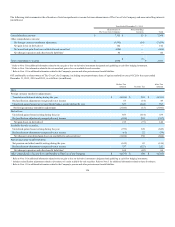
AOCI attributable to shareowners of The Coca-Cola Company is separately presented on our consolidated balance sheets as a component of The Coca-Cola
Company's shareowners' equity, which also includes our proportionate share of equity method investees' AOCI. Other comprehensive income (loss) ("OCI")
attributable to noncontrolling interests is allocated to, and included in, our balance sheets as part of the line item equity attributable to noncontrolling
interests.
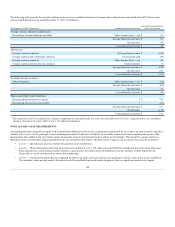
AOCI attributable to shareowners of The Coca-Cola Company consisted of the following (in millions):
December 31,
2014
Foreign currency translation adjustment
$ (5,226)
Accumulated derivative net gains (losses)
554
Unrealized net gains (losses) on available-for-sale securities
972
Adjustments to pension and other benefit liabilities
(2,077)
Accumulated other comprehensive income (loss)
$ (5,777)
125