Coca Cola 2015 Annual Report Download - page 59
Download and view the complete annual report
Please find page 59 of the 2015 Coca Cola annual report below. You can navigate through the pages in the report by either clicking on the pages listed below, or by using the keyword search tool below to find specific information within the annual report.-
 1
1 -
2
-
3
-
4
-
5
-
6
-
7
-
8
-
9
-
10
-
11
-
12
-
13
-
14
-
15
-
16
-
17
-
18
-
19
-
20
-
21
-
22
-
23
-
24
-
25
-
26
-
27
-
28
-
29
-
30
-
31
-
32
-
33
-
34
-
35
-
36
-
37
-
38
-
39
-
40
-
41
-
42
-
43
-
44
-
45
-
46
-
47
-
48
-
 49
49 -
 50
50 -
 51
51 -
 52
52 -
 53
53 -
 54
54 -
 55
55 -
 56
56 -
 57
57 -
 58
58 -
 59
59 -
 60
60 -
 61
61 -
 62
62 -
 63
63 -
 64
64 -
 65
65 -
 66
66 -
 67
67 -
 68
68 -
 69
69 -
70
-
71
-
72
-
73
-
74
-
75
-
76
-
77
-
78
-
79
-
80
-
81
-
82
-
83
-
84
-
85
-
86
-
87
-
88
-
89
-
90
-
91
-
92
-
93
-
94
-
95
-
96
-
97
-
98
-
99
-
100
-
101
-
102
-
103
-
104
-
105
-
106
-
107
-
108
-
109
-
110
-
111
-
112
-
113
-
114
-
115
-
116
-
117
-
118
-
119
-
120
-
121
-
122
-
123
-
124
-
125
-
126
-
127
-
128
-
129
-
130
-
131
-
132
-
133
-
134
-
135
-
136
-
137
-
138
-
139
-
140
-
141
-
142
-
143
-
144
-
145
-
146
-
147
-
148
-
149
-
150
-
151
-
152
-
153
-
154
-
155
-
156
-
157
-
158
-
159
-
160
-
161
-
162
-
163
-
164
-
165
-
166
-
167
-
168
-
169
-
170
-
171
-
172
-
173
-
174
-
175
-
176
-
177
-
178
-
179
-
180
-
181
-
182
-
183
-
184
-
185
-
186
-
187
-
188
-
189
-
190
-
191
-
192
-
193
-
194
-
195
-
196
-
197
-
198
-
199
-
200
-
201
-
202
-
203
-
204
-
205
-
206
-
207
-
208
-
209
-
210
-
211
-
212
-
213
-
214
-
215
-
216
-
217
-
218
-
219
-
220
 |
 |

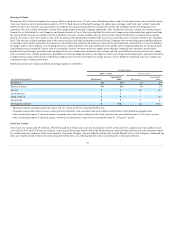
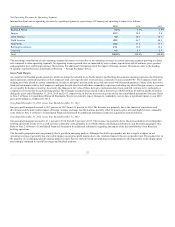
Year Ended December 31, 2014 versus Year Ended December 31, 2013
In 2014, foreign currency exchange rate fluctuations unfavorably impacted consolidated operating income by 6 percent. The unfavorable impact of changes
in foreign currency exchange rates was primarily due to a stronger U.S. dollar compared to certain other foreign currencies, including the South African rand,
Mexican peso, Brazilian real, Australian dollar and Japanese yen, which had an unfavorable impact on our Eurasia and Africa, Latin America, Asia Pacific
and Bottling Investments operating segments. The unfavorable impact of a stronger U.S. dollar compared to the currencies listed above was partially offset by
the impact of a weaker U.S. dollar compared to certain other foreign currencies, including the euro and British pound, which had a favorable impact on our
Europe and Bottling Investments operating segments. Refer to the heading "Liquidity, Capital Resources and Financial Position — Foreign Exchange"
below.
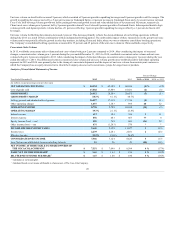
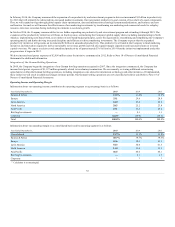
Operating income for Eurasia and Africa for the years ended December 31, 2014 and 2013 was $1,084 million and $1,087 million, respectively. The segment
was unfavorably impacted by fluctuations in foreign currency exchange rates of 12 percent. The unfavorable impact of the foreign currency exchange rates
was offset by favorable pricing across many of the segment's markets.
Europe’s operating income for the years ended December 31, 2014 and 2013 was $2,852 million and $2,859 million, respectively. The Europe group was
favorably impacted by foreign currency exchange rate fluctuations of 2 percent. The favorable impact of the foreign currency exchange rate fluctuations was
offset by lower concentrate sales volume and increased charges related to the Company’s productivity and reinvestment program.
Operating income in Latin America for the years ended December 31, 2014 and 2013 was $2,316 million and $2,908 million, respectively. Foreign currency
exchange rate fluctuations and the Venezuelan Fair Price Law unfavorably impacted operating income by 12 percent and 9 percent, respectively. Operating
income was also unfavorably impacted by the write-down of receivables from our local bottling partner in Venezuela. Refer to Note 1 of Notes to
Consolidated Financial Statements for additional information on the write-down of receivables. The impact of these items was partially offset by favorable
price mix in all of the segment's business units.
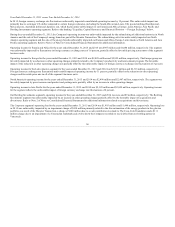
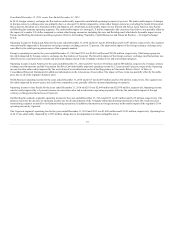
North America's operating income for the years ended December 31, 2014 and 2013 was $2,447 million and $2,432 million, respectively. The segment was
favorably impacted by positive price mix and lower commodity costs, partially offset by increased marketing investments.
Operating income in Asia Pacific for the years ended December 31, 2014 and 2013 was $2,448 million and $2,478 million, respectively. Operating income
was favorably impacted by a 5 percent increase in concentrate sales and a reduction in operating expenses, offset by the unfavorable impact of foreign
currency exchange rate fluctuations of 8 percent.
Our Bottling Investments segment's operating income for the years ended December 31, 2014 and 2013 was $9 million and $115 million, respectively. The
primary reason for the decrease in operating income was the deconsolidation of the Company's Brazilian bottling operations in July 2013 and increased
restructuring expenses incurred by our German bottling operations. In addition, fluctuations in foreign currency unfavorably impacted the segment's 2014
operating income by 4 percent.
The Corporate segment's operating loss for the years ended December 31, 2014 and 2013 was $1,448 million and $1,651 million, respectively. Operating loss
in 2013 was unfavorably impacted by a $195 million charge due to the impairment of certain intangible assets.
57