Coca Cola 2015 Annual Report Download - page 67
Download and view the complete annual report
Please find page 67 of the 2015 Coca Cola annual report below. You can navigate through the pages in the report by either clicking on the pages listed below, or by using the keyword search tool below to find specific information within the annual report.-
 1
1 -
2
-
3
-
4
-
5
-
6
-
7
-
8
-
9
-
10
-
11
-
12
-
13
-
14
-
15
-
16
-
17
-
18
-
19
-
20
-
21
-
22
-
23
-
24
-
25
-
26
-
27
-
28
-
29
-
30
-
31
-
32
-
33
-
34
-
35
-
36
-
37
-
38
-
39
-
40
-
41
-
42
-
43
-
44
-
45
-
46
-
47
-
48
-
49
-
50
-
51
-
52
-
53
-
54
-
55
-
56
-
 57
57 -
 58
58 -
 59
59 -
 60
60 -
 61
61 -
 62
62 -
 63
63 -
 64
64 -
 65
65 -
 66
66 -
 67
67 -
 68
68 -
 69
69 -
 70
70 -
 71
71 -
 72
72 -
 73
73 -
 74
74 -
 75
75 -
 76
76 -
 77
77 -
78
-
79
-
80
-
81
-
82
-
83
-
84
-
85
-
86
-
87
-
88
-
89
-
90
-
91
-
92
-
93
-
94
-
95
-
96
-
97
-
98
-
99
-
100
-
101
-
102
-
103
-
104
-
105
-
106
-
107
-
108
-
109
-
110
-
111
-
112
-
113
-
114
-
115
-
116
-
117
-
118
-
119
-
120
-
121
-
122
-
123
-
124
-
125
-
126
-
127
-
128
-
129
-
130
-
131
-
132
-
133
-
134
-
135
-
136
-
137
-
138
-
139
-
140
-
141
-
142
-
143
-
144
-
145
-
146
-
147
-
148
-
149
-
150
-
151
-
152
-
153
-
154
-
155
-
156
-
157
-
158
-
159
-
160
-
161
-
162
-
163
-
164
-
165
-
166
-
167
-
168
-
169
-
170
-
171
-
172
-
173
-
174
-
175
-
176
-
177
-
178
-
179
-
180
-
181
-
182
-
183
-
184
-
185
-
186
-
187
-
188
-
189
-
190
-
191
-
192
-
193
-
194
-
195
-
196
-
197
-
198
-
199
-
200
-
201
-
202
-
203
-
204
-
205
-
206
-
207
-
208
-
209
-
210
-
211
-
212
-
213
-
214
-
215
-
216
-
217
-
218
-
219
-
220
 |
 |

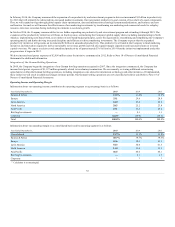
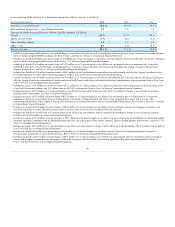
our major bottlers' financial performance, changes in the credit rating agencies' methodology in assessing our credit strength, or for any other reason, our cost
of borrowing could increase. Additionally, if certain bottlers' credit ratings were to decline, the Company's equity income could be reduced as a result of the
potential increase in interest expense for those bottlers.
In February 2016, Standard & Poor's downgraded the Company's long-term debt rating to AA- with a stable outlook. The Company does not believe that this
downgrade will have a material adverse effect on our cost of borrowing.
We monitor our financial ratios and, as indicated above, the rating agencies consider these ratios in assessing our credit ratings. Each rating agency employs a
different aggregation methodology and has different thresholds for the various financial ratios. These thresholds are not necessarily permanent, nor are they
always fully disclosed to our Company.
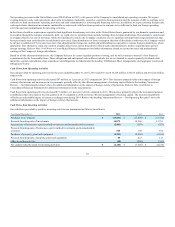
Our global presence and strong capital position give us access to key financial markets around the world, enabling us to raise funds at a low effective cost.
This posture, coupled with active management of our mix of short-term and long-term debt and our mix of fixed-rate and variable-rate debt, results in a lower
overall cost of borrowing. Our debt management policies, in conjunction with our share repurchase program and investment activity, can result in current
liabilities exceeding current assets.
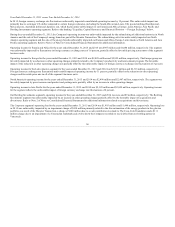
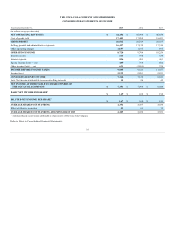
Issuances and payments of debt included both short-term and long-term financing activities. In 2015, the Company had issuances of debt of $40,434 million,
which included net issuances of $25,923 million of commercial paper and short-term debt with maturities greater than 90 days. The Company's total
issuances of debt also included long-term debt issuances of $14,511 million, net of related discounts, premiums and issuance costs.
During 2015, the Company made payments of $37,738 million, which included net payments of $208 million of commercial paper and short-term debt with
maturities of 90 days or less, $31,711 million of payments of commercial paper and short-term debt with maturities greater than 90 days and long-term debt
payments of $5,819 million. The long-term debt payments included the extinguishment of $2,039 million of long-term debt prior to maturity, which resulted
in associated charges of $320 million that were recorded in the line item interest expense in our consolidated statement of income. These charges included
the difference between the reacquisition price and the net carrying amount of the debt extinguished, including the impact of the related fair value hedging
relationship.
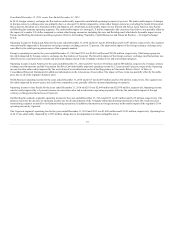
In 2014, the Company had issuances of debt of $41,674 million, which included net issuances of $317 million of commercial paper and short-term debt with
maturities of 90 days or less and $37,799 million of issuances of commercial paper and short-term debt with maturities greater than 90 days. The Company's
total issuances of debt also included long-term debt issuances of $3,558 million, net of related discounts and issuance costs.
During 2014, the Company made payments of debt of $36,962 million, which included $35,921 million for payments of commercial paper and short-term
debt with maturities greater than 90 days or less and long-term debt payments of $1,041 million.
In 2013, the Company had issuances of debt of $43,425 million, which included $35,944 million of issuances of commercial paper and short-term debt with
maturities greater than 90 days. The Company's total issuances of debt also included long-term debt issuances of $7,481 million, net of related discounts and
issuance costs.
During 2013, the Company made payments of debt of $38,714 million, which included $70 million of net payments of commercial paper and short-term debt
with maturities of 90 days or less, $35,199 million of payments of commercial paper and short-term debt with maturities greater than 90 days and long-term
debt payments of $3,445 million. The long-term debt payments included the extinguishment of $2,154 million of long-term debt prior to maturity, which
resulted in associated charges of $53 million, including hedge accounting adjustments reclassified from accumulated other comprehensive income, in the
line item interest expense in our consolidated statement of income during the year ended December 31, 2013.
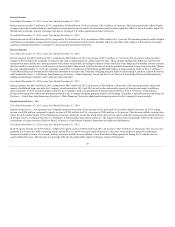
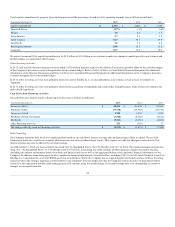
The carrying value of the Company's long-term debt included fair value adjustments related to the debt assumed from Old CCE of $411 million and $464
million as of December 31, 2015 and 2014, respectively. These fair value adjustments are being amortized over the number of years remaining until the
underlying debt matures. As of December 31, 2015, the weighted-average maturity of the assumed debt to which these fair value adjustments relate was
approximately 20 years. The amortization of these fair value adjustments will be a reduction of interest expense in future periods, which will typically result
in our interest expense being less than the actual interest paid to service the debt. Total interest paid was $515 million, $498 million and $498 million in
2015, 2014 and 2013, respectively. Refer to Note 10 of Notes to Consolidated Financial Statements for additional information related to the Company's long-
term debt balances.
65