Coca Cola 2015 Annual Report Download - page 80
Download and view the complete annual report
Please find page 80 of the 2015 Coca Cola annual report below. You can navigate through the pages in the report by either clicking on the pages listed below, or by using the keyword search tool below to find specific information within the annual report.-
 1
1 -
2
-
3
-
4
-
5
-
6
-
7
-
8
-
9
-
10
-
11
-
12
-
13
-
14
-
15
-
16
-
17
-
18
-
19
-
20
-
21
-
22
-
23
-
24
-
25
-
26
-
27
-
28
-
29
-
30
-
31
-
32
-
33
-
34
-
35
-
36
-
37
-
38
-
39
-
40
-
41
-
42
-
43
-
44
-
45
-
46
-
47
-
48
-
49
-
50
-
51
-
52
-
53
-
54
-
55
-
56
-
57
-
58
-
59
-
60
-
61
-
62
-
63
-
64
-
65
-
66
-
67
-
68
-
69
-
 70
70 -
 71
71 -
 72
72 -
 73
73 -
 74
74 -
 75
75 -
 76
76 -
 77
77 -
 78
78 -
 79
79 -
 80
80 -
 81
81 -
 82
82 -
 83
83 -
 84
84 -
 85
85 -
 86
86 -
 87
87 -
 88
88 -
 89
89 -
 90
90 -
91
-
92
-
93
-
94
-
95
-
96
-
97
-
98
-
99
-
100
-
101
-
102
-
103
-
104
-
105
-
106
-
107
-
108
-
109
-
110
-
111
-
112
-
113
-
114
-
115
-
116
-
117
-
118
-
119
-
120
-
121
-
122
-
123
-
124
-
125
-
126
-
127
-
128
-
129
-
130
-
131
-
132
-
133
-
134
-
135
-
136
-
137
-
138
-
139
-
140
-
141
-
142
-
143
-
144
-
145
-
146
-
147
-
148
-
149
-
150
-
151
-
152
-
153
-
154
-
155
-
156
-
157
-
158
-
159
-
160
-
161
-
162
-
163
-
164
-
165
-
166
-
167
-
168
-
169
-
170
-
171
-
172
-
173
-
174
-
175
-
176
-
177
-
178
-
179
-
180
-
181
-
182
-
183
-
184
-
185
-
186
-
187
-
188
-
189
-
190
-
191
-
192
-
193
-
194
-
195
-
196
-
197
-
198
-
199
-
200
-
201
-
202
-
203
-
204
-
205
-
206
-
207
-
208
-
209
-
210
-
211
-
212
-
213
-
214
-
215
-
216
-
217
-
218
-
219
-
220
 |
 |
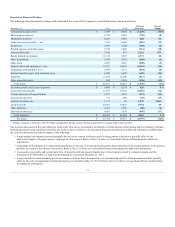
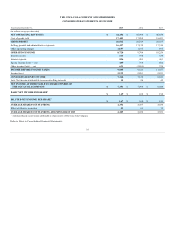
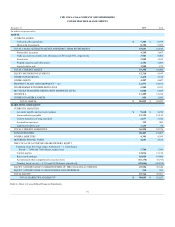
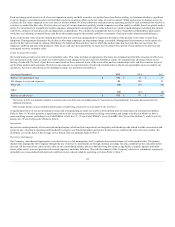
Year Ended December 31,
2014
2013
(In millions)
Consolidated net income
$ 7,124
$ 8,626
Depreciation and amortization
1,976
1,977
Stock-based compensation expense
209
227
Deferred income taxes
(40)
648
Equity (income) loss — net of dividends
(371)
(201)
Foreign currency adjustments
415
168
Significant (gains) losses on sales of assets — net
831
(670)
Other operating charges
761
465
Other items
149
234
Net change in operating assets and liabilities
(439)
(932)
Net cash provided by operating activities
10,615
10,542
Purchases of investments
(17,800)
(14,782)
Proceeds from disposals of investments
12,986
12,791
Acquisitions of businesses, equity method investments and nonmarketable securities
(389)
(353)
Proceeds from disposals of businesses, equity method investments and nonmarketable securities
148
872
Purchases of property, plant and equipment
(2,406)
(2,550)
Proceeds from disposals of property, plant and equipment
223
111
Other investing activities
(268)
(303)
Net cash provided by (used in) investing activities
(7,506)
(4,214)
Issuances of debt
41,674
43,425
Payments of debt
(36,962)
(38,714)
Issuances of stock
1,532
1,328
Purchases of stock for treasury
(4,162)
(4,832)
Dividends
(5,350)
(4,969)
Other financing activities
(363)
17
Net cash provided by (used in) financing activities
(3,631)
(3,745)
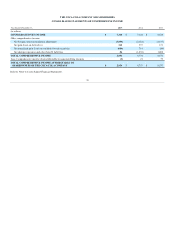
(934)
(611)
Net increase (decrease) during the year
(1,456)
1,972
Balance at beginning of year
10,414
8,442
Balance at end of year
$ 8,958
$ 10,414
Refer to Notes to Consolidated Financial Statements.
78