Coca Cola 2015 Annual Report Download - page 105
Download and view the complete annual report
Please find page 105 of the 2015 Coca Cola annual report below. You can navigate through the pages in the report by either clicking on the pages listed below, or by using the keyword search tool below to find specific information within the annual report.-
 1
1 -
2
-
3
-
4
-
5
-
6
-
7
-
8
-
9
-
10
-
11
-
12
-
13
-
14
-
15
-
16
-
17
-
18
-
19
-
20
-
21
-
22
-
23
-
24
-
25
-
26
-
27
-
28
-
29
-
30
-
31
-
32
-
33
-
34
-
35
-
36
-
37
-
38
-
39
-
40
-
41
-
42
-
43
-
44
-
45
-
46
-
47
-
48
-
49
-
50
-
51
-
52
-
53
-
54
-
55
-
56
-
57
-
58
-
59
-
60
-
61
-
62
-
63
-
64
-
65
-
66
-
67
-
68
-
69
-
70
-
71
-
72
-
73
-
74
-
75
-
76
-
77
-
78
-
79
-
80
-
81
-
82
-
83
-
84
-
85
-
86
-
87
-
88
-
89
-
90
-
91
-
92
-
93
-
94
-
 95
95 -
 96
96 -
 97
97 -
 98
98 -
 99
99 -
 100
100 -
 101
101 -
 102
102 -
 103
103 -
 104
104 -
 105
105 -
 106
106 -
 107
107 -
 108
108 -
 109
109 -
 110
110 -
 111
111 -
 112
112 -
 113
113 -
 114
114 -
 115
115 -
116
-
117
-
118
-
119
-
120
-
121
-
122
-
123
-
124
-
125
-
126
-
127
-
128
-
129
-
130
-
131
-
132
-
133
-
134
-
135
-
136
-
137
-
138
-
139
-
140
-
141
-
142
-
143
-
144
-
145
-
146
-
147
-
148
-
149
-
150
-
151
-
152
-
153
-
154
-
155
-
156
-
157
-
158
-
159
-
160
-
161
-
162
-
163
-
164
-
165
-
166
-
167
-
168
-
169
-
170
-
171
-
172
-
173
-
174
-
175
-
176
-
177
-
178
-
179
-
180
-
181
-
182
-
183
-
184
-
185
-
186
-
187
-
188
-
189
-
190
-
191
-
192
-
193
-
194
-
195
-
196
-
197
-
198
-
199
-
200
-
201
-
202
-
203
-
204
-
205
-
206
-
207
-
208
-
209
-
210
-
211
-
212
-
213
-
214
-
215
-
216
-
217
-
218
-
219
-
220
 |
 |
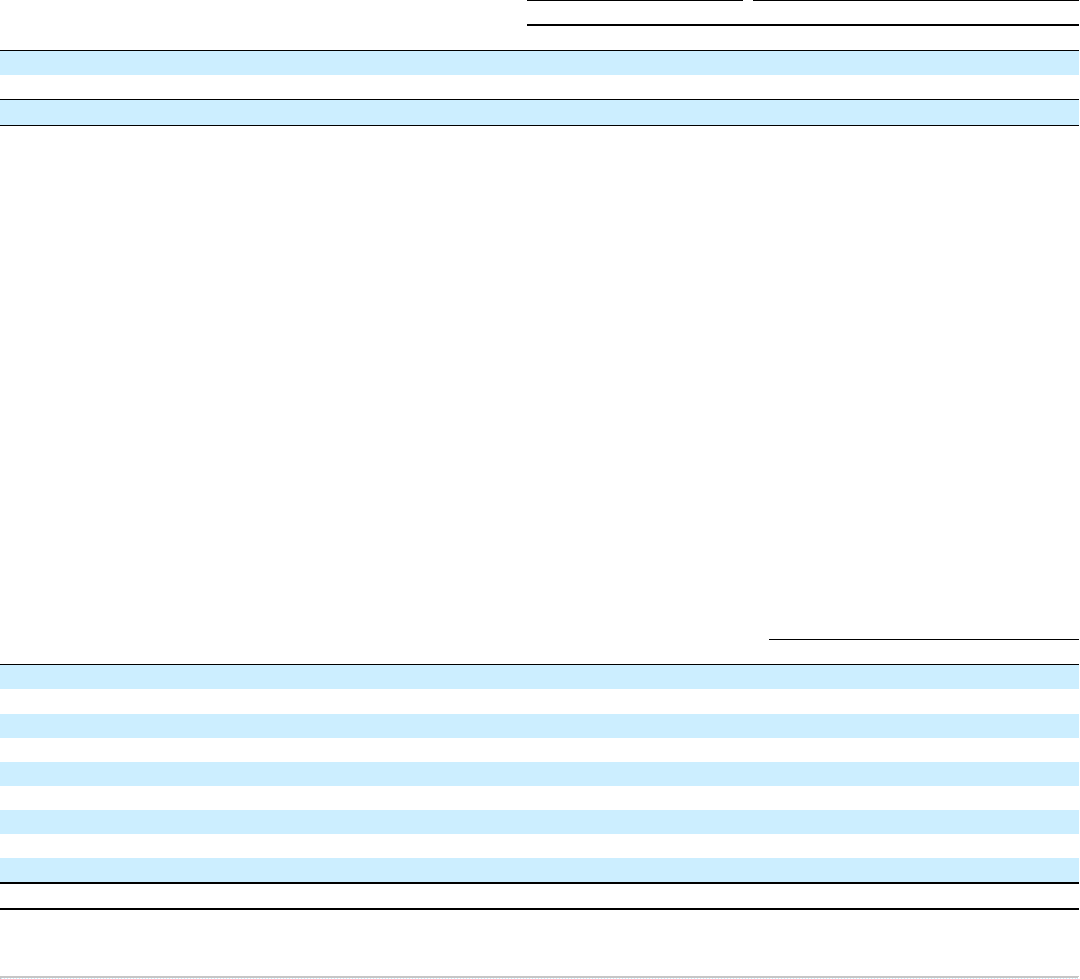
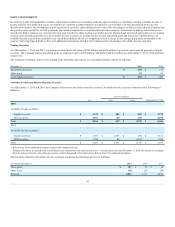
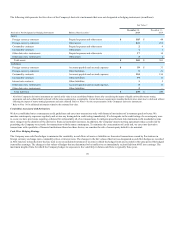
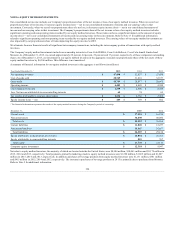
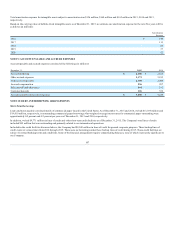
The following table summarizes the notional values and pretax impact of changes in the fair values of instruments designated as net investment hedges (in
millions):
Notional Amount
Gain (Loss) Recognized in OCI
as of December 31,
Year Ended December 31,
2014
2014 2013
Foreign currency contracts $ 2,047
$ 80 $ 61
Foreign currency denominated debt —
— —
Total $ 2,047
$ 80 $ 61
The Company did not reclassify any deferred gains or losses related to net investment hedges from AOCI to earnings during the years ended December 31,
2015, 2014 and 2013. In addition, the Company did not have any ineffectiveness related to net investment hedges during the years ended December 31,
2015, 2014 and 2013. The cash inflows and outflows associated with the Company's derivative contracts designated as net investment hedges are classified
in the line item other investing activities in our consolidated statements of cash flows.
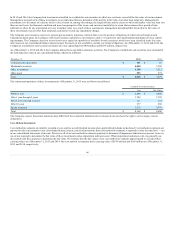
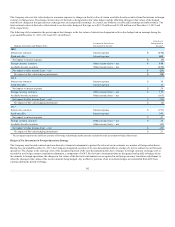
Economic (Non-Designated) Hedging Strategy
In addition to derivative instruments that are designated and qualify for hedge accounting, the Company also uses certain derivatives as economic hedges of
foreign currency, interest rate and commodity exposure. Although these derivatives were not designated and/or did not qualify for hedge accounting, they are
effective economic hedges. The changes in fair value of economic hedges are immediately recognized into earnings.
The Company uses foreign currency economic hedges to offset the earnings impact that fluctuations in foreign currency exchange rates have on certain
monetary assets and liabilities denominated in nonfunctional currencies. The changes in fair value of economic hedges used to offset those monetary assets
and liabilities are immediately recognized into earnings in the line item other income (loss) — net in our consolidated statements of income. In addition, we
use foreign currency economic hedges to minimize the variability in cash flows associated with fluctuations in foreign currency exchange rates. The changes
in fair values of economic hedges used to offset the variability in U.S. dollar net cash flows are recognized into earnings in the line items net operating
revenues or cost of goods sold in our consolidated statements of income, as applicable. The total notional values of derivatives related to our foreign
currency economic hedges were $3,605 million and $4,334 million as of December 31, 2015 and 2014, respectively.
The Company also uses certain derivatives as economic hedges to mitigate the price risk associated with the purchase of materials used in the manufacturing
process and for vehicle fuel. The changes in fair values of these economic hedges are immediately recognized into earnings in the line items net operating
revenues, cost of goods sold, and selling, general and administrative expenses in our consolidated statements of income, as applicable. The total notional
values of derivatives related to our economic hedges of this type were $893 million and $816 million as of December 31, 2015 and 2014, respectively.
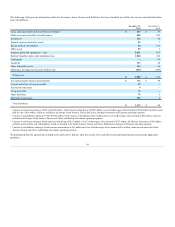
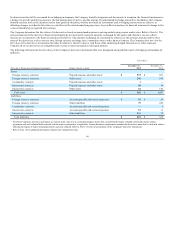
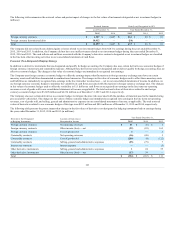
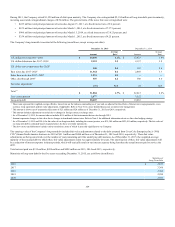
The following table presents the pretax impact that changes in the fair values of derivatives not designated as hedging instruments had on earnings during
the years ended December 31, 2015, 2014 and 2013 (in millions):
Derivatives Not Designated
as Hedging Instruments
Location of Gain (Loss)
Recognized in Income
Year Ended December 31,
2014
2013
Foreign currency contracts Net operating revenues
$ (6)
$ 5
Foreign currency contracts Other income (loss) — net
(85)
162
Foreign currency contracts Cost of goods sold
—
2
Commodity contracts Net operating revenues
(48)
5
Commodity contracts Cost of goods sold
(8)
(122)
Commodity contracts Selling, general and administrative expenses
(79)
7
Interest rate contracts Interest expense
—
(3)
Other derivative instruments Selling, general and administrative expenses
24
55
Other derivative instruments Other income (loss) — net
39
—
Total
$ (163)
$ 111
103