Coca Cola 2015 Annual Report Download - page 68
Download and view the complete annual report
Please find page 68 of the 2015 Coca Cola annual report below. You can navigate through the pages in the report by either clicking on the pages listed below, or by using the keyword search tool below to find specific information within the annual report.-
 1
1 -
2
-
3
-
4
-
5
-
6
-
7
-
8
-
9
-
10
-
11
-
12
-
13
-
14
-
15
-
16
-
17
-
18
-
19
-
20
-
21
-
22
-
23
-
24
-
25
-
26
-
27
-
28
-
29
-
30
-
31
-
32
-
33
-
34
-
35
-
36
-
37
-
38
-
39
-
40
-
41
-
42
-
43
-
44
-
45
-
46
-
47
-
48
-
49
-
50
-
51
-
52
-
53
-
54
-
55
-
56
-
57
-
 58
58 -
 59
59 -
 60
60 -
 61
61 -
 62
62 -
 63
63 -
 64
64 -
 65
65 -
 66
66 -
 67
67 -
 68
68 -
 69
69 -
 70
70 -
 71
71 -
 72
72 -
 73
73 -
 74
74 -
 75
75 -
 76
76 -
 77
77 -
 78
78 -
79
-
80
-
81
-
82
-
83
-
84
-
85
-
86
-
87
-
88
-
89
-
90
-
91
-
92
-
93
-
94
-
95
-
96
-
97
-
98
-
99
-
100
-
101
-
102
-
103
-
104
-
105
-
106
-
107
-
108
-
109
-
110
-
111
-
112
-
113
-
114
-
115
-
116
-
117
-
118
-
119
-
120
-
121
-
122
-
123
-
124
-
125
-
126
-
127
-
128
-
129
-
130
-
131
-
132
-
133
-
134
-
135
-
136
-
137
-
138
-
139
-
140
-
141
-
142
-
143
-
144
-
145
-
146
-
147
-
148
-
149
-
150
-
151
-
152
-
153
-
154
-
155
-
156
-
157
-
158
-
159
-
160
-
161
-
162
-
163
-
164
-
165
-
166
-
167
-
168
-
169
-
170
-
171
-
172
-
173
-
174
-
175
-
176
-
177
-
178
-
179
-
180
-
181
-
182
-
183
-
184
-
185
-
186
-
187
-
188
-
189
-
190
-
191
-
192
-
193
-
194
-
195
-
196
-
197
-
198
-
199
-
200
-
201
-
202
-
203
-
204
-
205
-
206
-
207
-
208
-
209
-
210
-
211
-
212
-
213
-
214
-
215
-
216
-
217
-
218
-
219
-
220
 |
 |
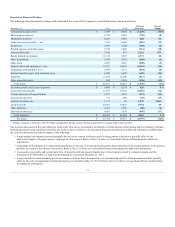
Issuances of Stock
The issuances of stock in 2015, 2014 and 2013 were primarily related to the exercise of stock options by Company employees.
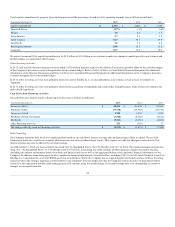
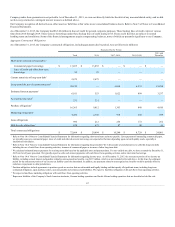
Share Repurchases
On July 20, 2006, the Board of Directors of the Company authorized a share repurchase program of up to 600 million shares of the Company's common stock.
The program took effect on October 31, 2006. Although there were approximately 43 million shares that were yet to be purchased under this share repurchase
program, the Board of Directors authorized a new share repurchase program of up to 500 million shares of the Company's common stock on October 18, 2012
("2012 Plan"). The 2012 Plan allowed the Company to continue repurchasing shares following the completion of the prior program. The table below presents
annual shares repurchased and average price per share:
Year Ended December 31,
2014
2013
Number of shares repurchased (in millions)
98
121
Average price per share
$ 40.97
$ 39.84
Since the inception of our initial share repurchase program in 1984 through our current program as of December 31, 2015, we have purchased 3.3 billion
shares of our Company's common stock at an average price per share of $15.36. In addition to shares repurchased under the share repurchase program
authorized by our Board of Directors, the Company's treasury stock activity also includes shares surrendered to the Company to pay the exercise price and/or
to satisfy tax withholding obligations in connection with so-called stock swap exercises of employee stock options and/or the vesting of restricted stock
issued to employees. In 2015, we repurchased $3.5 billion of our stock. However, due to the timing of settlements, the total amount of treasury stock
purchases that settled during 2015 was $3.6 billion, which includes treasury stock that was purchased and settled during 2015 as well as treasury stock
purchased in December 2014 that settled in early 2015. The net impact of the Company's treasury stock issuance and purchase activities in 2015 resulted in a
net cash outflow of $2.3 billion. We currently expect to repurchase $2.0 billion to $2.5 billion of our stock during 2016, net of proceeds from the issuance of
treasury stock due to the exercise of employee stock options.
Dividends
The Company paid dividends of $5,741 million, $5,350 million and $4,969 million during the years ended December 31, 2015, 2014 and 2013, respectively.
At its February 2016 meeting, our Board of Directors increased our quarterly dividend by 6 percent, raising it to $0.35 per share, equivalent to a full year
dividend of $1.40 per share in 2016. This is our 54th consecutive annual increase. Our annual common stock dividend was $1.32 per share, $1.22 per share
and $1.12 per share in 2015, 2014 and 2013, respectively. The 2015 dividend represented an 8 percent increase from 2014, and the 2014 dividend
represented a 9 percent increase from 2013.
Off-Balance Sheet Arrangements and Aggregate Contractual Obligations
Off-Balance Sheet Arrangements
In accordance with the definition under SEC rules, the following qualify as off-balance sheet arrangements:
• any obligation under certain guarantee contracts;
• a retained or contingent interest in assets transferred to an unconsolidated entity or similar arrangement that serves as credit, liquidity or market risk
support to that entity for such assets;
• any obligation under certain derivative instruments; and
• any obligation arising out of a material variable interest held by the registrant in an unconsolidated entity that provides financing, liquidity, market
risk or credit risk support to the registrant, or engages in leasing, hedging or research and development services with the registrant.
As of December 31, 2015, we were contingently liable for guarantees of indebtedness owed by third parties of $572 million, of which $263 million was
related to VIEs. These guarantees are primarily related to third-party customers, bottlers, vendors and container manufacturing operations and have arisen
through the normal course of business. These guarantees have various terms, and none of these guarantees was individually significant. The amount
represents the maximum potential future payments that we could be required to make under the guarantees; however, we do not consider it probable that we
will be required to satisfy these guarantees. Management concluded that the likelihood of any significant amounts being paid by our
66