Coca Cola 2015 Annual Report Download - page 70
Download and view the complete annual report
Please find page 70 of the 2015 Coca Cola annual report below. You can navigate through the pages in the report by either clicking on the pages listed below, or by using the keyword search tool below to find specific information within the annual report.-
 1
1 -
2
-
3
-
4
-
5
-
6
-
7
-
8
-
9
-
10
-
11
-
12
-
13
-
14
-
15
-
16
-
17
-
18
-
19
-
20
-
21
-
22
-
23
-
24
-
25
-
26
-
27
-
28
-
29
-
30
-
31
-
32
-
33
-
34
-
35
-
36
-
37
-
38
-
39
-
40
-
41
-
42
-
43
-
44
-
45
-
46
-
47
-
48
-
49
-
50
-
51
-
52
-
53
-
54
-
55
-
56
-
57
-
58
-
59
-
 60
60 -
 61
61 -
 62
62 -
 63
63 -
 64
64 -
 65
65 -
 66
66 -
 67
67 -
 68
68 -
 69
69 -
 70
70 -
 71
71 -
 72
72 -
 73
73 -
 74
74 -
 75
75 -
 76
76 -
 77
77 -
 78
78 -
 79
79 -
 80
80 -
81
-
82
-
83
-
84
-
85
-
86
-
87
-
88
-
89
-
90
-
91
-
92
-
93
-
94
-
95
-
96
-
97
-
98
-
99
-
100
-
101
-
102
-
103
-
104
-
105
-
106
-
107
-
108
-
109
-
110
-
111
-
112
-
113
-
114
-
115
-
116
-
117
-
118
-
119
-
120
-
121
-
122
-
123
-
124
-
125
-
126
-
127
-
128
-
129
-
130
-
131
-
132
-
133
-
134
-
135
-
136
-
137
-
138
-
139
-
140
-
141
-
142
-
143
-
144
-
145
-
146
-
147
-
148
-
149
-
150
-
151
-
152
-
153
-
154
-
155
-
156
-
157
-
158
-
159
-
160
-
161
-
162
-
163
-
164
-
165
-
166
-
167
-
168
-
169
-
170
-
171
-
172
-
173
-
174
-
175
-
176
-
177
-
178
-
179
-
180
-
181
-
182
-
183
-
184
-
185
-
186
-
187
-
188
-
189
-
190
-
191
-
192
-
193
-
194
-
195
-
196
-
197
-
198
-
199
-
200
-
201
-
202
-
203
-
204
-
205
-
206
-
207
-
208
-
209
-
210
-
211
-
212
-
213
-
214
-
215
-
216
-
217
-
218
-
219
-
220
 |
 |

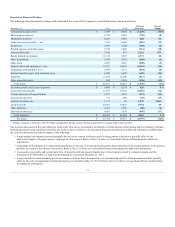
The total accrued benefit liability for pension and other postretirement benefit plans recognized as of December 31, 2015, was $2,619 million. Refer to
Note 13 of Notes to Consolidated Financial Statements. This amount is impacted by, among other items, pension expense, funding levels, plan amendments,
changes in plan demographics and assumptions, and the investment return on plan assets. Because the accrued liability does not represent expected liquidity
needs, we did not include this amount in the contractual obligations table.
We generally expect to fund all future pension contributions with cash flows from operating activities. Our international pension plans are generally funded
in accordance with local laws and income tax regulations.
As of December 31, 2015, the projected benefit obligation of the U.S. qualified pension plans was $6,405 million, and the fair value of plan assets was
$5,628 million. The projected benefit obligation of all pension plans other than the U.S. qualified pension plans was $2,754 million, and the fair value of all
other pension plan assets was $2,061 million. The majority of this underfunding is attributable to an international pension plan for certain non-U.S.
employees that is unfunded due to tax law restrictions, as well as certain unfunded U.S. nonqualified pension plans. These U.S. nonqualified pension plans
provide, for certain associates, benefits that are not permitted to be funded through a qualified plan because of limits imposed by the Internal Revenue Code
of 1986. The expected benefit payments for these unfunded pension plans are not included in the table above. However, we anticipate annual benefit
payments for these unfunded pension plans to be $72 million in 2016 and remain near that level through 2031, decreasing annually thereafter. Refer to
Note 13 of Notes to Consolidated Financial Statements.
The Company expects to contribute an additional $512 million to our global pension plans, the majority of which will be allocated to our U.S. plans. Refer to
Note 13 of Notes to Consolidated Financial Statements. We did not include our estimated contributions to our various plans in the table above.
In general, we are self-insured for large portions of many different types of claims; however, we do use commercial insurance above our self-insured retentions
to reduce the Company's risk of catastrophic loss. Our reserves for the Company's self-insured losses are estimated through actuarial procedures of the
insurance industry and by using industry assumptions, adjusted for our specific expectations based on our claim history. As of December 31, 2015, our self-
insurance reserves totaled $560 million. Refer to Note 11 of Notes to Consolidated Financial Statements. We did not include estimated payments related to
our self-insurance reserves in the table above.
Deferred income tax liabilities as of December 31, 2015 were $5,434 million. Refer to Note 14 of Notes to Consolidated Financial Statements. This amount is
not included in the total contractual obligations table because we believe that presentation would not be meaningful. Deferred income tax liabilities are
calculated based on temporary differences between the tax bases of assets and liabilities and their respective book bases, which will result in taxable amounts
in future years when the liabilities are settled at their reported financial statement amounts. The results of these calculations do not have a direct connection
with the amount of cash taxes to be paid in any future periods. As a result, scheduling deferred income tax liabilities as payments due by period could be
misleading, because this scheduling would not relate to liquidity needs.
Foreign Exchange
Our international operations are subject to certain opportunities and risks, including currency fluctuations and governmental actions. We closely monitor our
operations in each country and seek to adopt appropriate strategies that are responsive to changing economic and political environments, and to fluctuations
in foreign currencies.
68