Electronic Arts 2012 Annual Report Download - page 110
Download and view the complete annual report
Please find page 110 of the 2012 Electronic Arts annual report below. You can navigate through the pages in the report by either clicking on the pages listed below, or by using the keyword search tool below to find specific information within the annual report.-
 1
1 -
2
-
3
-
4
-
5
-
6
-
7
-
8
-
9
-
10
-
11
-
12
-
13
-
14
-
15
-
16
-
17
-
18
-
19
-
20
-
21
-
22
-
23
-
24
-
25
-
26
-
27
-
28
-
29
-
30
-
31
-
32
-
33
-
34
-
35
-
36
-
37
-
38
-
39
-
40
-
41
-
42
-
43
-
44
-
45
-
46
-
47
-
48
-
49
-
50
-
51
-
52
-
53
-
54
-
55
-
56
-
57
-
58
-
59
-
60
-
61
-
62
-
63
-
64
-
65
-
66
-
67
-
68
-
69
-
70
-
71
-
72
-
73
-
74
-
75
-
76
-
77
-
78
-
79
-
80
-
81
-
82
-
83
-
84
-
85
-
86
-
87
-
88
-
89
-
90
-
91
-
92
-
93
-
94
-
95
-
96
-
97
-
98
-
99
-
 100
100 -
 101
101 -
 102
102 -
 103
103 -
 104
104 -
 105
105 -
 106
106 -
 107
107 -
 108
108 -
 109
109 -
 110
110 -
 111
111 -
 112
112 -
 113
113 -
 114
114 -
 115
115 -
 116
116 -
 117
117 -
 118
118 -
 119
119 -
 120
120 -
121
-
122
-
123
-
124
-
125
-
126
-
127
-
128
-
129
-
130
-
131
-
132
-
133
-
134
-
135
-
136
-
137
-
138
-
139
-
140
-
141
-
142
-
143
-
144
-
145
-
146
-
147
-
148
-
149
-
150
-
151
-
152
-
153
-
154
-
155
-
156
-
157
-
158
-
159
-
160
-
161
-
162
-
163
-
164
-
165
-
166
-
167
-
168
-
169
-
170
-
171
-
172
-
173
-
174
-
175
-
176
-
177
-
178
-
179
-
180
-
181
-
182
-
183
-
184
-
185
-
186
-
187
-
188
-
189
-
190
-
191
-
192
-
193
-
194
-
195
-
196
-
197
-
198
-
199
-
200
-
201
-
202
-
203
-
204
-
205
-
206
-
207
-
208
 |
 |

PART II
Item 5: Market for Registrant’s Common Equity, Related Stockholder Matters and Issuer Purchases of
Equity Securities
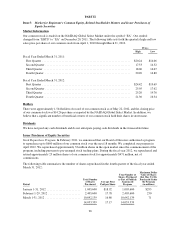
Market Information
Our common stock is traded on the NASDAQ Global Select Market under the symbol “EA”. Our symbol
changed from “ERTS” to “EA” on December 20, 2011. The following table sets forth the quarterly high and low
sales price per share of our common stock from April 1, 2010 through March 31, 2012.
Prices
High Low
Fiscal Year Ended March 31, 2011:
First Quarter ............................................................ $20.24 $14.06
Second Quarter .......................................................... 17.53 14.32
Third Quarter ........................................................... 18.06 14.67
Fourth Quarter .......................................................... 20.20 14.80
Fiscal Year Ended March 31, 2012:
First Quarter ............................................................ $24.42 $19.69
Second Quarter .......................................................... 25.05 17.62
Third Quarter ........................................................... 25.20 19.76
Fourth Quarter .......................................................... 21.30 16.34
Holders
There were approximately 1,544 holders of record of our common stock as of May 22, 2012, and the closing price
of our common stock was $14.26 per share as reported by the NASDAQ Global Select Market. In addition, we
believe that a significant number of beneficial owners of our common stock hold their shares in street name.
Dividends
We have not paid any cash dividends and do not anticipate paying cash dividends in the foreseeable future.
Issuer Purchases of Equity Securities
Stock Repurchase Program. In February 2011, we announced that our Board of Directors authorized a program
to repurchase up to $600 million of our common stock over the next 18 months. We completed our program in
April 2012. We repurchased approximately 32 million shares in the open market since the commencement of the
program, including pursuant to pre-arranged stock trading plans. During the fiscal year 2012, we repurchased and
retired approximately 25 million shares of our common stock for approximately $471 million, net of
commissions.
The following table summarizes the number of shares repurchased in the fourth quarter of the fiscal year ended
March 31, 2012:
Period
Total Number
of Shares
Purchased
Average Price
Paid per Share
Total Number of
Shares Purchased
as Part of Publicly
Announced
Program
Maximum Dollar
Value of Shares
that May Yet Be
Purchased Under
the Program
(in millions)
January 1-31, 2012 ....................... 1,005,600 $18.92 1,005,600 $293
February 1-29, 2012 ...................... 2,405,600 17.78 2,405,600 250
March 1-31, 2012 ........................ 10,642,139 16.86 10,642,139 71
14,053,339 17.17 14,053,339
26