Electronic Arts 2012 Annual Report Download - page 183
Download and view the complete annual report
Please find page 183 of the 2012 Electronic Arts annual report below. You can navigate through the pages in the report by either clicking on the pages listed below, or by using the keyword search tool below to find specific information within the annual report.-
 1
1 -
2
-
3
-
4
-
5
-
6
-
7
-
8
-
9
-
10
-
11
-
12
-
13
-
14
-
15
-
16
-
17
-
18
-
19
-
20
-
21
-
22
-
23
-
24
-
25
-
26
-
27
-
28
-
29
-
30
-
31
-
32
-
33
-
34
-
35
-
36
-
37
-
38
-
39
-
40
-
41
-
42
-
43
-
44
-
45
-
46
-
47
-
48
-
49
-
50
-
51
-
52
-
53
-
54
-
55
-
56
-
57
-
58
-
59
-
60
-
61
-
62
-
63
-
64
-
65
-
66
-
67
-
68
-
69
-
70
-
71
-
72
-
73
-
74
-
75
-
76
-
77
-
78
-
79
-
80
-
81
-
82
-
83
-
84
-
85
-
86
-
87
-
88
-
89
-
90
-
91
-
92
-
93
-
94
-
95
-
96
-
97
-
98
-
99
-
100
-
101
-
102
-
103
-
104
-
105
-
106
-
107
-
108
-
109
-
110
-
111
-
112
-
113
-
114
-
115
-
116
-
117
-
118
-
119
-
120
-
121
-
122
-
123
-
124
-
125
-
126
-
127
-
128
-
129
-
130
-
131
-
132
-
133
-
134
-
135
-
136
-
137
-
138
-
139
-
140
-
141
-
142
-
143
-
144
-
145
-
146
-
147
-
148
-
149
-
150
-
151
-
152
-
153
-
154
-
155
-
156
-
157
-
158
-
159
-
160
-
161
-
162
-
163
-
164
-
165
-
166
-
167
-
168
-
169
-
170
-
171
-
172
-
 173
173 -
 174
174 -
 175
175 -
 176
176 -
 177
177 -
 178
178 -
 179
179 -
 180
180 -
 181
181 -
 182
182 -
 183
183 -
 184
184 -
 185
185 -
 186
186 -
 187
187 -
 188
188 -
 189
189 -
 190
190 -
 191
191 -
 192
192 -
 193
193 -
194
-
195
-
196
-
197
-
198
-
199
-
200
-
201
-
202
-
203
-
204
-
205
-
206
-
207
-
208
 |
 |

Annual Report
We determine the fair value of our share-based payment awards as follows:
•Restricted Stock Units, Restricted Stock, and Performance-Based Restricted Stock Units. The fair value of
restricted stock units, restricted stock, and performance-based restricted stock units (other than market-
based restricted stock units) is determined based on the quoted market price of our common stock on the
date of grant. Performance-based restricted stock units include grants made (1) to certain members of
executive management primarily granted in fiscal year 2008 and (2) in connection with certain
acquisitions.
•Market-Based Restricted Stock Units. Market-based restricted stock units consist of grants of
performance-based restricted stock units to certain members of executive management (referred to herein
as “market-based restricted stock units”). The fair value of our market-based restricted stock units is
determined using a Monte-Carlo simulation model. Key assumptions for the Monte-Carlo simulation
model are the risk-free interest rate, expected volatility, expected dividends and correlation coefficient.
•Stock Options and Employee Stock Purchase Plan. The fair value of stock options and stock purchase
rights granted pursuant to our equity incentive plans and our 2000 Employee Stock Purchase Plan
(“ESPP”), respectively, is determined using the Black-Scholes valuation model based on the multiple-
award valuation method. Key assumptions of the Black-Scholes valuation model are the risk-free interest
rate, expected volatility, expected term and expected dividends.
The determination of the fair value of market-based restricted stock units, stock options and ESPP is affected by
assumptions regarding subjective and complex variables. Generally, our assumptions are based on historical
information and judgment is required to determine if historical trends may be indicators of future outcomes.
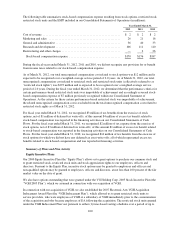
The estimated assumptions used in the Black-Scholes valuation model to value our stock option grants and ESPP
were as follows:
Stock Option Grants ESPP
Year Ended March 31, Year Ended March 31,
2012 2011 2010 2012 2011 2010
Risk-free interest rate ......... 0.4-1.8% 0.3 - 2.6% 1.4 - 3.1% 0.1 - 0.2% 0.2 - 0.3% 0.2 - 0.4%
Expected volatility ............ 40-46% 39-45% 40-48% 39-41% 34-38% 35-57%
Weighted-average volatility .... 43% 42% 45% 41% 36% 39%
Expected term ............... 4.4years 4.2 years 4.2 years 6-12 months 6-12 months 6-12 months
Expected dividends ........... None None None None None None
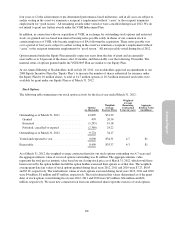
The estimated assumptions used in the Monte-Carlo simulation model to value our market-based restricted stock
units were as follows:
Year Ended
March 31, 2012
Risk-free interest rate ............................................................. 0.2-0.6%
Expected volatility ............................................................... 14-83%
Weighted-average volatility ........................................................ 35%
Expected dividends .............................................................. None
There were no market-based restricted stock units granted during the fiscal years ended March 31, 2011 and
2010.
Stock-Based Compensation Expense
Employee stock-based compensation expense recognized during the fiscal years ended March 31, 2012, 2011 and
2010 was calculated based on awards ultimately expected to vest and has been reduced for estimated forfeitures.
In subsequent periods, if actual forfeitures differ from those estimates, an adjustment to stock-based
compensation expense will be recognized at that time.
99