Electronic Arts 2012 Annual Report Download - page 122
Download and view the complete annual report
Please find page 122 of the 2012 Electronic Arts annual report below. You can navigate through the pages in the report by either clicking on the pages listed below, or by using the keyword search tool below to find specific information within the annual report.-
 1
1 -
2
-
3
-
4
-
5
-
6
-
7
-
8
-
9
-
10
-
11
-
12
-
13
-
14
-
15
-
16
-
17
-
18
-
19
-
20
-
21
-
22
-
23
-
24
-
25
-
26
-
27
-
28
-
29
-
30
-
31
-
32
-
33
-
34
-
35
-
36
-
37
-
38
-
39
-
40
-
41
-
42
-
43
-
44
-
45
-
46
-
47
-
48
-
49
-
50
-
51
-
52
-
53
-
54
-
55
-
56
-
57
-
58
-
59
-
60
-
61
-
62
-
63
-
64
-
65
-
66
-
67
-
68
-
69
-
70
-
71
-
72
-
73
-
74
-
75
-
76
-
77
-
78
-
79
-
80
-
81
-
82
-
83
-
84
-
85
-
86
-
87
-
88
-
89
-
90
-
91
-
92
-
93
-
94
-
95
-
96
-
97
-
98
-
99
-
100
-
101
-
102
-
103
-
104
-
105
-
106
-
107
-
108
-
109
-
110
-
111
-
 112
112 -
 113
113 -
 114
114 -
 115
115 -
 116
116 -
 117
117 -
 118
118 -
 119
119 -
 120
120 -
 121
121 -
 122
122 -
 123
123 -
 124
124 -
 125
125 -
 126
126 -
 127
127 -
 128
128 -
 129
129 -
 130
130 -
 131
131 -
 132
132 -
133
-
134
-
135
-
136
-
137
-
138
-
139
-
140
-
141
-
142
-
143
-
144
-
145
-
146
-
147
-
148
-
149
-
150
-
151
-
152
-
153
-
154
-
155
-
156
-
157
-
158
-
159
-
160
-
161
-
162
-
163
-
164
-
165
-
166
-
167
-
168
-
169
-
170
-
171
-
172
-
173
-
174
-
175
-
176
-
177
-
178
-
179
-
180
-
181
-
182
-
183
-
184
-
185
-
186
-
187
-
188
-
189
-
190
-
191
-
192
-
193
-
194
-
195
-
196
-
197
-
198
-
199
-
200
-
201
-
202
-
203
-
204
-
205
-
206
-
207
-
208
 |
 |

RESULTS OF OPERATIONS
Our fiscal year is reported on a 52- or 53-week period that ends on the Saturday nearest March 31. Our results of
operations for the fiscal years ended March 31, 2012 and 2011 each contained 52 weeks and ended on March 31,
2012 and April 2, 2011, respectively. Our results of operations for the fiscal year ended March 31, 2010
contained 53 weeks and ended on April 3, 2010. For simplicity of disclosure, all fiscal periods are referred to as
ending on a calendar month-end.
Comparison of Fiscal Year 2012 to Fiscal Year 2011
Net Revenue
Net revenue consists of sales generated from (1) video games sold as packaged goods or as digital downloads and
designed for play on video game consoles (such as the PLAYSTATION 3, Xbox 360 and Wii), and PCs,
(2) video games for mobile devices (such as the Apple iPhone and Google Android compatible phones),
(3) video games for tablets and electronic readers such as the Apple iPad and Amazon Kindle, (4) software
products and content and online game services associated with these products, (5) programming third-party
websites with our game content, (6) allowing other companies to manufacture and sell our products in
conjunction with other products, and (7) advertisements on our online web pages and in our games.
We provide three different measures of our Net Revenue. Two of these measures are presented in accordance
with accounting principles generally accepted in the United States (“U.S. GAAP”) – (1) Net Revenue by Product
Revenue and Service and Other Revenue and (2) Net Revenue by Geography. The third measure is a non-GAAP
financial measure – Net Revenue by Revenue Composition, which is primarily based on method of distribution.
We use this third non-GAAP financial measure internally to evaluate our operating performance, when planning,
forecasting and analyzing future periods, and when assessing the performance of our management team.
Management places a greater emphasis and focus on assessing our business through a review of the Net Revenue
by Revenue Composition than by Net Revenue by Product Revenue and Service and Other Revenue. These two
measures differ as (1) Net Revenue by Product Revenue and Service and Other Revenue reflects the deferral and
recognition of revenue in periods subsequent to the date of sale due to U.S. GAAP while Net Revenue by
Revenue Composition does not, and (2) both measures contain a different aggregation of sales from one another.
For instance, Service and other revenue does not include the majority of our full-game digital download and
mobile sales that are fully included in our Digital revenue. Further, Service and other revenue includes all of our
revenue associated with MMO games while software sales associated with our MMOs are included in either
Digital revenue or Publishing and other revenue depending on whether the sale was a full-game digital download
or a packaged goods sale.
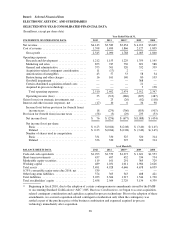
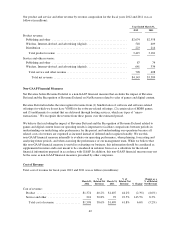
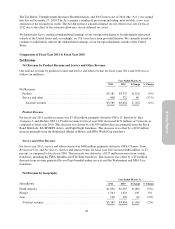
Net Revenue by Product Revenue and Service and Other Revenue
Our total net revenue by product revenue and service and other revenue for the fiscal years ended March 31,
2012 and 2011 was as follows (in millions):
Year Ended March 31,
2012 2011 $ Change % Change
Net revenue:
Product ................................................ $3,415 $3,181 $234 7%
Service and other ........................................ 728 408 320 78%
Total net revenue ...................................... $4,143 $3,589 $554 15%
Product Revenue
Our product revenue includes revenue associated with the sale of game software, whether delivered via a disc
(i.e., packaged goods) or via the Internet (i.e., full-game download), that do not require our continuous hosting
38