Electronic Arts 2012 Annual Report Download - page 167
Download and view the complete annual report
Please find page 167 of the 2012 Electronic Arts annual report below. You can navigate through the pages in the report by either clicking on the pages listed below, or by using the keyword search tool below to find specific information within the annual report.-
 1
1 -
2
-
3
-
4
-
5
-
6
-
7
-
8
-
9
-
10
-
11
-
12
-
13
-
14
-
15
-
16
-
17
-
18
-
19
-
20
-
21
-
22
-
23
-
24
-
25
-
26
-
27
-
28
-
29
-
30
-
31
-
32
-
33
-
34
-
35
-
36
-
37
-
38
-
39
-
40
-
41
-
42
-
43
-
44
-
45
-
46
-
47
-
48
-
49
-
50
-
51
-
52
-
53
-
54
-
55
-
56
-
57
-
58
-
59
-
60
-
61
-
62
-
63
-
64
-
65
-
66
-
67
-
68
-
69
-
70
-
71
-
72
-
73
-
74
-
75
-
76
-
77
-
78
-
79
-
80
-
81
-
82
-
83
-
84
-
85
-
86
-
87
-
88
-
89
-
90
-
91
-
92
-
93
-
94
-
95
-
96
-
97
-
98
-
99
-
100
-
101
-
102
-
103
-
104
-
105
-
106
-
107
-
108
-
109
-
110
-
111
-
112
-
113
-
114
-
115
-
116
-
117
-
118
-
119
-
120
-
121
-
122
-
123
-
124
-
125
-
126
-
127
-
128
-
129
-
130
-
131
-
132
-
133
-
134
-
135
-
136
-
137
-
138
-
139
-
140
-
141
-
142
-
143
-
144
-
145
-
146
-
147
-
148
-
149
-
150
-
151
-
152
-
153
-
154
-
155
-
156
-
 157
157 -
 158
158 -
 159
159 -
 160
160 -
 161
161 -
 162
162 -
 163
163 -
 164
164 -
 165
165 -
 166
166 -
 167
167 -
 168
168 -
 169
169 -
 170
170 -
 171
171 -
 172
172 -
 173
173 -
 174
174 -
 175
175 -
 176
176 -
 177
177 -
178
-
179
-
180
-
181
-
182
-
183
-
184
-
185
-
186
-
187
-
188
-
189
-
190
-
191
-
192
-
193
-
194
-
195
-
196
-
197
-
198
-
199
-
200
-
201
-
202
-
203
-
204
-
205
-
206
-
207
-
208
 |
 |

Annual Report
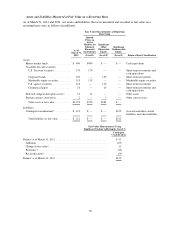
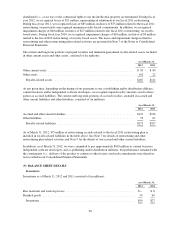
The final allocation of the purchase price was completed during the third quarter of fiscal year 2012. The
following table summarizes the fair values of assets acquired and liabilities assumed at the date of acquisition (in
millions):
Current assets ......................................................................... $ 62
Property and equipment, net .............................................................. 6
Goodwill ............................................................................. 563
Finite-lived intangible assets .............................................................. 302
Contingent consideration ................................................................. (95)
Deferred income taxes, net ............................................................... (51)
Other liabilities ........................................................................ (55)
Total purchase price .................................................................. $732
All of the goodwill is assigned to our EA Labels operating segment. None of the goodwill recognized upon
acquisition is deductible for tax purposes. See Note 6 for additional information related to the changes in the
carrying amount of goodwill and Note 18 for segment information.
Finite-lived intangible assets acquired in this transaction are being amortized on a straight-line basis over their
estimated lives ranging from three to nine years. The intangible assets as of the date of the acquisition include:
Gross Carrying
Amount
Weighted-Average
Useful Life
(in millions) (in years)
Developed and core technology ...................................... $245 6
Trade names and trademarks ........................................ 40 9
In-process research and development ................................. 15 5
Other intangibles ................................................. 2 4
Total finite-lived intangibles ...................................... $302 6
In connection with our acquisition of PopCap, we acquired in-process research and development assets valued at
approximately $15 million in relation to game software that had not reached technical feasibility as of the date of
acquisition. The fair value of PopCap’s products under development was determined using the income approach, which
discounts expected future cash flows from the acquired in-process technology to present value. The discount rates used in
the present value calculations were derived from an average weighted average cost of capital of 13 percent.
There were six in-process research and development projects acquired as of the acquisition date each with $4
million or less of assigned fair value and $15 million of aggregate fair value. Additionally each project had less
than $2 million of estimated costs to complete and $5 million aggregate cost to complete. As of the acquisition
date, the weighted-average estimated percentage completion of all six projects combined was 36 percent.
Benefits from the development efforts have begun to be received in the fourth quarter of fiscal year 2012 and the
remaining development efforts are expected to be completed in fiscal year 2013.
The results of operations of PopCap and the estimated fair market values of the assets acquired and liabilities
assumed have been included in our Consolidated Financial Statements since the date of acquisition. Pro forma
results of operations have not been presented because the effect of the acquisition was not material to our
Consolidated Statements of Operations.
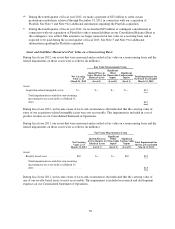
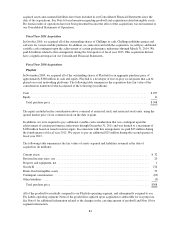
KlickNation and Other Fiscal 2012 Acquisitions
In November 2011, we acquired KlickNation, a developer of social role-playing games. During the fiscal year
ended March 31, 2012, we completed three other acquisitions. These business combinations were completed for
total cash consideration of approximately $55 million. These acquisitions were not material to our Consolidated
Balance Sheets and Statements of Operations. The results of operations and the estimated fair value of the
83