Electronic Arts 2012 Annual Report Download - page 144
Download and view the complete annual report
Please find page 144 of the 2012 Electronic Arts annual report below. You can navigate through the pages in the report by either clicking on the pages listed below, or by using the keyword search tool below to find specific information within the annual report.-
 1
1 -
2
-
3
-
4
-
5
-
6
-
7
-
8
-
9
-
10
-
11
-
12
-
13
-
14
-
15
-
16
-
17
-
18
-
19
-
20
-
21
-
22
-
23
-
24
-
25
-
26
-
27
-
28
-
29
-
30
-
31
-
32
-
33
-
34
-
35
-
36
-
37
-
38
-
39
-
40
-
41
-
42
-
43
-
44
-
45
-
46
-
47
-
48
-
49
-
50
-
51
-
52
-
53
-
54
-
55
-
56
-
57
-
58
-
59
-
60
-
61
-
62
-
63
-
64
-
65
-
66
-
67
-
68
-
69
-
70
-
71
-
72
-
73
-
74
-
75
-
76
-
77
-
78
-
79
-
80
-
81
-
82
-
83
-
84
-
85
-
86
-
87
-
88
-
89
-
90
-
91
-
92
-
93
-
94
-
95
-
96
-
97
-
98
-
99
-
100
-
101
-
102
-
103
-
104
-
105
-
106
-
107
-
108
-
109
-
110
-
111
-
112
-
113
-
114
-
115
-
116
-
117
-
118
-
119
-
120
-
121
-
122
-
123
-
124
-
125
-
126
-
127
-
128
-
129
-
130
-
131
-
132
-
133
-
 134
134 -
 135
135 -
 136
136 -
 137
137 -
 138
138 -
 139
139 -
 140
140 -
 141
141 -
 142
142 -
 143
143 -
 144
144 -
 145
145 -
 146
146 -
 147
147 -
 148
148 -
 149
149 -
 150
150 -
 151
151 -
 152
152 -
 153
153 -
 154
154 -
155
-
156
-
157
-
158
-
159
-
160
-
161
-
162
-
163
-
164
-
165
-
166
-
167
-
168
-
169
-
170
-
171
-
172
-
173
-
174
-
175
-
176
-
177
-
178
-
179
-
180
-
181
-
182
-
183
-
184
-
185
-
186
-
187
-
188
-
189
-
190
-
191
-
192
-
193
-
194
-
195
-
196
-
197
-
198
-
199
-
200
-
201
-
202
-
203
-
204
-
205
-
206
-
207
-
208
 |
 |
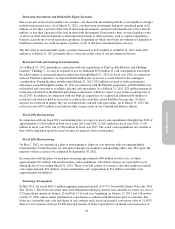
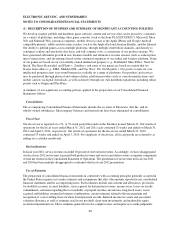
Operations. In certain cases, the amount of such gains and losses will significantly differ from the amount of
gains and losses recognized on the underlying foreign-currency-denominated monetary asset or liability, in which
case our results will be impacted. As of March 31, 2012, we had foreign currency forward contracts to purchase
and sell approximately $242 million in foreign currencies. Of this amount, $197 million represented contracts to
sell foreign currencies in exchange for U.S. dollars, $37 million to purchase foreign currency in exchange for
U.S. dollars, and $8 million to sell foreign currency in exchange for British pound sterling. As of March 31,
2011, we had foreign currency forward contracts to purchase and sell approximately $187 million in foreign
currencies. Of this amount, $140 million represented contracts to sell foreign currencies in exchange for U.S.
dollars, $31 million to purchase foreign currency in exchange for U.S. dollars and $16 million to sell foreign
currency in exchange for British pound sterling. The fair value of our foreign currency forward contracts was
immaterial as of March 31, 2012 and 2011.
We believe the counterparties to these foreign currency forward and option contracts are creditworthy
multinational commercial banks. While we believe the risk of counterparty nonperformance is not material, the
disruption in the global financial markets has impacted some of the financial institutions with which we do
business. Further, the continued sovereign debt crisis in Europe could lead to increased counterparty risk with
respect to financial institutions and other business partners, who are particularly vulnerable to the instability in
certain European markets. A sustained decline in the financial stability of financial institutions as a result of the
disruption in the financial markets could affect our ability to secure credit-worthy counterparties for our foreign
currency hedging programs.
Notwithstanding our efforts to mitigate some foreign currency exchange rate risks, there can be no assurance that
our hedging activities will adequately protect us against the risks associated with foreign currency fluctuations.
As of March 31, 2012, a hypothetical adverse foreign currency exchange rate movement of 10 percent or 15
percent would have resulted in potential declines in the fair value of the premiums on our foreign currency option
contracts used in cash flow hedging of less than $2 million in each scenario. As of March 31, 2012, a
hypothetical adverse foreign currency exchange rate movement of 10 percent or 15 percent would have resulted
in potential losses on our foreign currency forward contracts used in balance sheet hedging of $24 million and
$37 million, respectively. This sensitivity analysis assumes a parallel adverse shift of all foreign currency
exchange rates against the U.S. dollar; however, all foreign currency exchange rates do not always move in such
manner and actual results may differ materially.
Interest Rate Risk
Our exposure to market risk for changes in interest rates relates primarily to our short-term investment portfolio.
We manage our interest rate risk by maintaining an investment portfolio generally consisting of debt instruments
of high credit quality and relatively short maturities. However, because short-term investments mature relatively
quickly and are required to be reinvested at the then-current market rates, interest income on a portfolio
consisting of short-term investments is more subject to market fluctuations than a portfolio of longer term
investments. Additionally, the contractual terms of the investments do not permit the issuer to call, prepay or
otherwise settle the investments at prices less than the stated par value. Our investments are held for purposes
other than trading. Also, we do not use derivative financial instruments in our short-term investment portfolio.
60