Electronic Arts 2012 Annual Report Download - page 186
Download and view the complete annual report
Please find page 186 of the 2012 Electronic Arts annual report below. You can navigate through the pages in the report by either clicking on the pages listed below, or by using the keyword search tool below to find specific information within the annual report.-
 1
1 -
2
-
3
-
4
-
5
-
6
-
7
-
8
-
9
-
10
-
11
-
12
-
13
-
14
-
15
-
16
-
17
-
18
-
19
-
20
-
21
-
22
-
23
-
24
-
25
-
26
-
27
-
28
-
29
-
30
-
31
-
32
-
33
-
34
-
35
-
36
-
37
-
38
-
39
-
40
-
41
-
42
-
43
-
44
-
45
-
46
-
47
-
48
-
49
-
50
-
51
-
52
-
53
-
54
-
55
-
56
-
57
-
58
-
59
-
60
-
61
-
62
-
63
-
64
-
65
-
66
-
67
-
68
-
69
-
70
-
71
-
72
-
73
-
74
-
75
-
76
-
77
-
78
-
79
-
80
-
81
-
82
-
83
-
84
-
85
-
86
-
87
-
88
-
89
-
90
-
91
-
92
-
93
-
94
-
95
-
96
-
97
-
98
-
99
-
100
-
101
-
102
-
103
-
104
-
105
-
106
-
107
-
108
-
109
-
110
-
111
-
112
-
113
-
114
-
115
-
116
-
117
-
118
-
119
-
120
-
121
-
122
-
123
-
124
-
125
-
126
-
127
-
128
-
129
-
130
-
131
-
132
-
133
-
134
-
135
-
136
-
137
-
138
-
139
-
140
-
141
-
142
-
143
-
144
-
145
-
146
-
147
-
148
-
149
-
150
-
151
-
152
-
153
-
154
-
155
-
156
-
157
-
158
-
159
-
160
-
161
-
162
-
163
-
164
-
165
-
166
-
167
-
168
-
169
-
170
-
171
-
172
-
173
-
174
-
175
-
 176
176 -
 177
177 -
 178
178 -
 179
179 -
 180
180 -
 181
181 -
 182
182 -
 183
183 -
 184
184 -
 185
185 -
 186
186 -
 187
187 -
 188
188 -
 189
189 -
 190
190 -
 191
191 -
 192
192 -
 193
193 -
 194
194 -
 195
195 -
 196
196 -
197
-
198
-
199
-
200
-
201
-
202
-
203
-
204
-
205
-
206
-
207
-
208
 |
 |

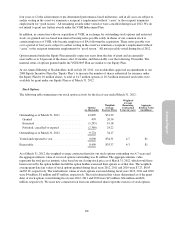
The following table summarizes outstanding and exercisable stock options as of March 31, 2012:
Options Outstanding Options Exercisable
Range of
Exercise Prices
Number
of Shares
(in thousands)
Weighted-
Average
Remaining
Contractual
Term (in years)
Weighted-
Average
Exercise
Prices
Potential
Dilution
Number
of Shares
(in thousands)
Weighted-
Average
Exercise
Prices
Potential
Dilution
$2.61-$19.99 2,676 6.66 $17.16 0.8% 2,211 $16.88 0.7%
20.00-39.99 3,227 4.65 24.95 1.1% 2,686 25.75 0.9%
40.00-59.99 3,157 3.65 51.15 1.0% 2,879 51.28 0.9%
60.00-65.93 714 2.04 64.67 0.2% 714 64.67 0.2%
$2.61-$65.93 9,774 4.69 34.17 3.1% 8,490 35.37 2.7%
Potential dilution is computed by dividing the options in the related range of exercise prices by 320 million
shares of common stock, which were issued and outstanding as of March 31, 2012.
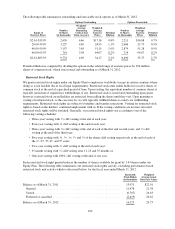
Restricted Stock Rights
We grant restricted stock rights under our Equity Plan to employees worldwide (except in certain countries where
doing so is not feasible due to local legal requirements). Restricted stock units entitle holders to receive shares of
common stock at the end of a specified period of time. Upon vesting, the equivalent number of common shares is
typically issued net of required tax withholdings, if any. Restricted stock is issued and outstanding upon grant;
however, restricted stock award holders are restricted from selling the shares until they vest. Upon granting or
vesting of restricted stock, as the case may be, we will typically withhold shares to satisfy tax withholding
requirements. Restricted stock rights are subject to forfeiture and transfer restrictions. Vesting for restricted stock
rights is based on the holders’ continued employment with us. If the vesting conditions are not met, unvested
restricted stock rights will be forfeited. Generally, our restricted stock rights vest according to one of the
following vesting schedules:
• Three-year vesting with
1
⁄
3
cliff vesting at the end of each year;
• Four-year vesting with
1
⁄
4
cliff vesting at the end of each year;
• Three-year vesting with
1
⁄
4
cliff vesting at the end of each of the first and second years, and
1
⁄
2
cliff
vesting at the end of the third year;
• Five-year vesting with
1
⁄
9
,
2
⁄
9
,
3
⁄
9
,
2
⁄
9
and
1
⁄
9
of the shares cliff vesting respectively at the end of each of
the 1st,2
nd,3
rd,4
th, and 5th years;
• Two-year vesting with
1
⁄
2
cliff vesting at the end of each year;
• 35 month vesting with
1
⁄
3
cliff vesting after 11, 23 and 35 months or;
• One-year vesting with 100% cliff vesting at the end of one year.
Each restricted stock right granted reduces the number of shares available for grant by 1.43 shares under our
Equity Plan. The following table summarizes our restricted stock rights activity, excluding performance-based
restricted stock unit activity which is discussed below, for the fiscal year ended March 31, 2012:
Restricted
Stock Rights
(in thousands)
Weighted-
Average Grant
Date Fair Values
Balance as of March 31, 2011 ......................................... 13,971 $22.01
Granted ......................................................... 11,478 21.38
Vested .......................................................... (6,707) 24.63
Forfeited or cancelled .............................................. (2,419) 20.42
Balance as of March 31, 2012 ......................................... 16,323 20.73
102