Electronic Arts 2012 Annual Report Download - page 145
Download and view the complete annual report
Please find page 145 of the 2012 Electronic Arts annual report below. You can navigate through the pages in the report by either clicking on the pages listed below, or by using the keyword search tool below to find specific information within the annual report.-
 1
1 -
2
-
3
-
4
-
5
-
6
-
7
-
8
-
9
-
10
-
11
-
12
-
13
-
14
-
15
-
16
-
17
-
18
-
19
-
20
-
21
-
22
-
23
-
24
-
25
-
26
-
27
-
28
-
29
-
30
-
31
-
32
-
33
-
34
-
35
-
36
-
37
-
38
-
39
-
40
-
41
-
42
-
43
-
44
-
45
-
46
-
47
-
48
-
49
-
50
-
51
-
52
-
53
-
54
-
55
-
56
-
57
-
58
-
59
-
60
-
61
-
62
-
63
-
64
-
65
-
66
-
67
-
68
-
69
-
70
-
71
-
72
-
73
-
74
-
75
-
76
-
77
-
78
-
79
-
80
-
81
-
82
-
83
-
84
-
85
-
86
-
87
-
88
-
89
-
90
-
91
-
92
-
93
-
94
-
95
-
96
-
97
-
98
-
99
-
100
-
101
-
102
-
103
-
104
-
105
-
106
-
107
-
108
-
109
-
110
-
111
-
112
-
113
-
114
-
115
-
116
-
117
-
118
-
119
-
120
-
121
-
122
-
123
-
124
-
125
-
126
-
127
-
128
-
129
-
130
-
131
-
132
-
133
-
134
-
 135
135 -
 136
136 -
 137
137 -
 138
138 -
 139
139 -
 140
140 -
 141
141 -
 142
142 -
 143
143 -
 144
144 -
 145
145 -
 146
146 -
 147
147 -
 148
148 -
 149
149 -
 150
150 -
 151
151 -
 152
152 -
 153
153 -
 154
154 -
 155
155 -
156
-
157
-
158
-
159
-
160
-
161
-
162
-
163
-
164
-
165
-
166
-
167
-
168
-
169
-
170
-
171
-
172
-
173
-
174
-
175
-
176
-
177
-
178
-
179
-
180
-
181
-
182
-
183
-
184
-
185
-
186
-
187
-
188
-
189
-
190
-
191
-
192
-
193
-
194
-
195
-
196
-
197
-
198
-
199
-
200
-
201
-
202
-
203
-
204
-
205
-
206
-
207
-
208
 |
 |

Annual Report
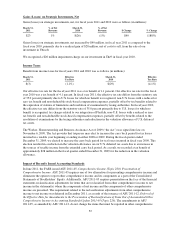
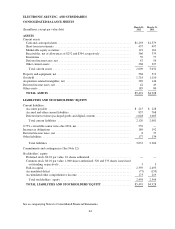
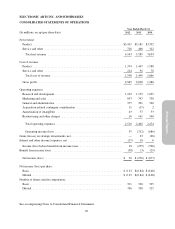
As of March 31, 2012 and 2011, our short-term investments were classified as available-for-sale securities and,
consequently, were recorded at fair market value with unrealized gains or losses resulting from changes in fair
value reported as a separate component of accumulated other comprehensive income, net of tax, in stockholders’
equity. Our portfolio of short-term investments consisted of the following investment categories, summarized by
fair value as of March 31, 2012 and 2011 (in millions):
As of March 31,
2012 2011
U.S. Treasury securities ..................................................... $166 $124
Corporate bonds ........................................................... 150 253
U.S. agency securities ...................................................... 116 102
Commercial paper ......................................................... 5 18
Total short-term investments ............................................... $437 $497
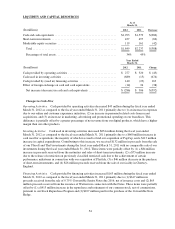
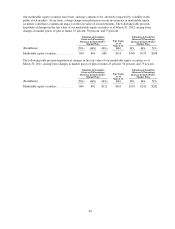
Notwithstanding our efforts to manage interest rate risks, there can be no assurance that we will be adequately
protected against risks associated with interest rate fluctuations. At any time, a sharp change in interest rates
could have a significant impact on the fair value of our investment portfolio. The following table presents the
hypothetical changes in the fair value in our short-term investment portfolio as of March 31, 2012, arising from
potential changes in interest rates. The modeling technique estimates the change in fair value from immediate
hypothetical parallel shifts in the yield curve of plus or minus 50 basis points (“BPS”), 100 BPS, and 150 BPS.
(In millions)
Valuation of Securities
Given an Interest Rate Decrease
of X Basis Points
Fair Value
as of
March 31,
2012
Valuation of Securities Given
an Interest Rate Increase of
X Basis Points
(150 BPS) (100 BPS) (50 BPS) 50 BPS 100 BPS 150 BPS
U.S. Treasury securities .............. $169 $168 $167 $166 $165 $164 $162
Corporate bonds .................... 152 151 150 150 148 148 147
U.S. agency securities ................ 119 118 117 116 116 115 115
Commercial paper .................. 5 5 5 5 5 5 5
Total short-term investments ........ $445 $442 $439 $437 $434 $432 $429
The following table presents the hypothetical changes in the fair value in our short-term investment portfolio as
of March 31, 2011, arising from selected potential changes in interest rates.
(In millions)
Valuation of Securities
Given an Interest Rate Decrease
of X Basis Points
Fair Value
as of
March 31,
2011
Valuation of Securities Given
an Interest Rate Increase of
X Basis Points
(150 BPS) (100 BPS) (50 BPS) 50 BPS 100 BPS 150 BPS
Corporate bonds .................... $258 $257 $255 $253 $252 $250 $249
U.S. Treasury securities .............. 126 125 124 124 123 122 121
U.S. agency securities ................ 104 103 103 102 101 101 100
Commercial paper .................. 18 18 18 18 18 18 18
Total short-term investments ........ $506 $503 $500 $497 $494 $491 $488
Market Price Risk
The fair value of our marketable equity securities in publicly-traded companies is subject to market price
volatility and foreign currency risk for investments denominated in foreign currencies. As of March 31, 2012 and
2011, our marketable equity securities were classified as available-for-sale securities and, consequently, were
recorded on our Consolidated Balance Sheets at fair market value with unrealized gains or losses resulting from
changes in fair value reported as a separate component of accumulated other comprehensive income, net of tax,
in stockholders’ equity. The fair value of our marketable equity securities as of March 31, 2012 and 2011 was
$119 million and $161 million, respectively.
61