Electronic Arts 2012 Annual Report Download - page 133
Download and view the complete annual report
Please find page 133 of the 2012 Electronic Arts annual report below. You can navigate through the pages in the report by either clicking on the pages listed below, or by using the keyword search tool below to find specific information within the annual report.-
 1
1 -
2
-
3
-
4
-
5
-
6
-
7
-
8
-
9
-
10
-
11
-
12
-
13
-
14
-
15
-
16
-
17
-
18
-
19
-
20
-
21
-
22
-
23
-
24
-
25
-
26
-
27
-
28
-
29
-
30
-
31
-
32
-
33
-
34
-
35
-
36
-
37
-
38
-
39
-
40
-
41
-
42
-
43
-
44
-
45
-
46
-
47
-
48
-
49
-
50
-
51
-
52
-
53
-
54
-
55
-
56
-
57
-
58
-
59
-
60
-
61
-
62
-
63
-
64
-
65
-
66
-
67
-
68
-
69
-
70
-
71
-
72
-
73
-
74
-
75
-
76
-
77
-
78
-
79
-
80
-
81
-
82
-
83
-
84
-
85
-
86
-
87
-
88
-
89
-
90
-
91
-
92
-
93
-
94
-
95
-
96
-
97
-
98
-
99
-
100
-
101
-
102
-
103
-
104
-
105
-
106
-
107
-
108
-
109
-
110
-
111
-
112
-
113
-
114
-
115
-
116
-
117
-
118
-
119
-
120
-
121
-
122
-
 123
123 -
 124
124 -
 125
125 -
 126
126 -
 127
127 -
 128
128 -
 129
129 -
 130
130 -
 131
131 -
 132
132 -
 133
133 -
 134
134 -
 135
135 -
 136
136 -
 137
137 -
 138
138 -
 139
139 -
 140
140 -
 141
141 -
 142
142 -
 143
143 -
144
-
145
-
146
-
147
-
148
-
149
-
150
-
151
-
152
-
153
-
154
-
155
-
156
-
157
-
158
-
159
-
160
-
161
-
162
-
163
-
164
-
165
-
166
-
167
-
168
-
169
-
170
-
171
-
172
-
173
-
174
-
175
-
176
-
177
-
178
-
179
-
180
-
181
-
182
-
183
-
184
-
185
-
186
-
187
-
188
-
189
-
190
-
191
-
192
-
193
-
194
-
195
-
196
-
197
-
198
-
199
-
200
-
201
-
202
-
203
-
204
-
205
-
206
-
207
-
208
 |
 |

Annual Report
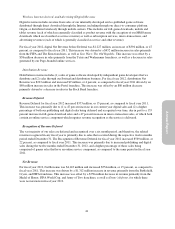
Revenue Deferral
Revenue Deferral for fiscal year 2011 increased $411 million, or 17 percent, as compared to fiscal year 2010.
This increase was primarily due to (1) a 46 percent increase in our digital sales and (2) a higher percentage of
both our publishing and digital sales being deferred and recognized over time, due in part to a 148 percent
increase in micro-transaction sales and a 27 percent increase in full-game download sales, of which both contain
an online service component which requires revenue recognition as the service is delivered.
Recognition of Revenue Deferral
The vast majority of our sales are deferred and recognized over a six month period, and therefore the related
revenue recognized in any fiscal year is primarily due to sales that occurred during the respective twelve months
period ended December 31. The Recognition of Revenue Deferral for fiscal year 2011 increased $677 million, or
37 percent, as compared to fiscal year 2010. This increase was primarily due to increased publishing and digital
sales during the 18 months ended March 31, 2011, and a higher percentage of those sales being comprised of
game sales that have an online service component, as compared to fiscal year 2010.
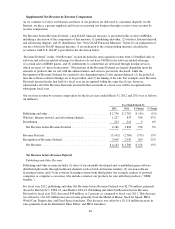
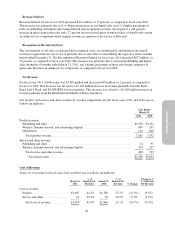
Net Revenue
For fiscal year 2011, Net Revenue was $3,589 million and decreased $65 million, or 2 percent, as compared to
fiscal year 2010. This decrease was driven by a $1,125 million decrease in revenue primarily from the Rock
Band, Left 4 Dead, and EA SPORTS Active franchises. This decrease was offset by a $1,060 million increase in
revenue primarily from the Battlefield and Medal of Honor franchises.
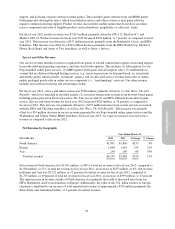
Our product and service and other revenue by revenue composition for the fiscal years 2011 and 2010 was as
follows (in millions):
Year Ended
March 31,
2011 2010
Product revenue:
Publishing and other ......................................................... $2,558 $2,431
Wireless, Internet-derived, and advertising (digital) ................................ 409 295
Distribution ................................................................ 214 606
Total product revenue ...................................................... 3,181 3,332
Service and other revenue:
Publishing and other ......................................................... 74 95
Wireless, Internet-derived, and advertising (digital) ................................ 334 227
Total service and other revenue .............................................. 408 322
Total net revenue ........................................................ $3,589 $3,654
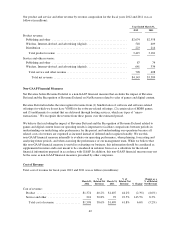
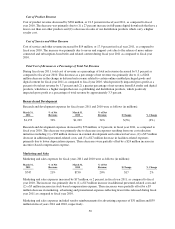
Cost of Revenue
Total cost of revenue for fiscal years 2011 and 2010 was as follows (in millions):
March 31,
2011
%of
Related Net
Revenue
March 31,
2010
%of
Related Net
Revenue % Change
Change as a
% of Related
Net Revenue
Cost of revenue:
Product ....................... $1,407 44.2% $1,788 53.7% (21.3%) (9.5%)
Service and other ................ 92 22.5% 78 24.2% 17.9% (1.7%)
Total cost of revenue ........... $1,499 41.8% $1,866 51.1% (19.7%) (9.3%)
49