Electronic Arts 2012 Annual Report Download - page 113
Download and view the complete annual report
Please find page 113 of the 2012 Electronic Arts annual report below. You can navigate through the pages in the report by either clicking on the pages listed below, or by using the keyword search tool below to find specific information within the annual report.-
 1
1 -
2
-
3
-
4
-
5
-
6
-
7
-
8
-
9
-
10
-
11
-
12
-
13
-
14
-
15
-
16
-
17
-
18
-
19
-
20
-
21
-
22
-
23
-
24
-
25
-
26
-
27
-
28
-
29
-
30
-
31
-
32
-
33
-
34
-
35
-
36
-
37
-
38
-
39
-
40
-
41
-
42
-
43
-
44
-
45
-
46
-
47
-
48
-
49
-
50
-
51
-
52
-
53
-
54
-
55
-
56
-
57
-
58
-
59
-
60
-
61
-
62
-
63
-
64
-
65
-
66
-
67
-
68
-
69
-
70
-
71
-
72
-
73
-
74
-
75
-
76
-
77
-
78
-
79
-
80
-
81
-
82
-
83
-
84
-
85
-
86
-
87
-
88
-
89
-
90
-
91
-
92
-
93
-
94
-
95
-
96
-
97
-
98
-
99
-
100
-
101
-
102
-
 103
103 -
 104
104 -
 105
105 -
 106
106 -
 107
107 -
 108
108 -
 109
109 -
 110
110 -
 111
111 -
 112
112 -
 113
113 -
 114
114 -
 115
115 -
 116
116 -
 117
117 -
 118
118 -
 119
119 -
 120
120 -
 121
121 -
 122
122 -
 123
123 -
124
-
125
-
126
-
127
-
128
-
129
-
130
-
131
-
132
-
133
-
134
-
135
-
136
-
137
-
138
-
139
-
140
-
141
-
142
-
143
-
144
-
145
-
146
-
147
-
148
-
149
-
150
-
151
-
152
-
153
-
154
-
155
-
156
-
157
-
158
-
159
-
160
-
161
-
162
-
163
-
164
-
165
-
166
-
167
-
168
-
169
-
170
-
171
-
172
-
173
-
174
-
175
-
176
-
177
-
178
-
179
-
180
-
181
-
182
-
183
-
184
-
185
-
186
-
187
-
188
-
189
-
190
-
191
-
192
-
193
-
194
-
195
-
196
-
197
-
198
-
199
-
200
-
201
-
202
-
203
-
204
-
205
-
206
-
207
-
208
 |
 |

Annual Report
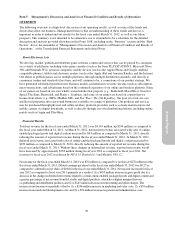
Item 7: Management’s Discussion and Analysis of Financial Condition and Results of Operations
OVERVIEW
The following overview is a high-level discussion of our operating results, as well as some of the trends and
drivers that affect our business. Management believes that an understanding of these trends and drivers is
important in order to understand our results for the fiscal year ended March 31, 2012, as well as our future
prospects. This summary is not intended to be exhaustive, nor is it intended to be a substitute for the detailed
discussion and analysis provided elsewhere in this Form 10-K, including in the “Business” section and the “Risk
Factors” above, the remainder of “Management’s Discussion and Analysis of Financial Condition and Results of
Operations,” or the Consolidated Financial Statements and related Notes.
About Electronic Arts
We develop, market, publish and distribute game software content and services that can be played by consumers
on a variety of platforms, including video game consoles (such as the Sony PLAYSTATION 3, Microsoft Xbox
360, and Nintendo Wii), personal computers, mobile devices (such as the Apple iPhone and Google Android
compatible phones), tablets and electronic readers (such as the Apple iPad and Amazon Kindle), and the Internet.
Our ability to publish games across multiple platforms, through multiple distribution channels, and directly to
consumers (online and wirelessly) has been, and will continue to be, a cornerstone of our product strategy. We
have generated substantial growth in new business models and alternative revenue streams (such as subscription,
micro-transactions, and advertising) based on the continued expansion of our online and wireless platform. Some
of our games are based on our own wholly-owned intellectual property (e.g., Battlefield, Mass Effect, Need for
Speed, The Sims, Bejeweled, and Plants v. Zombies), and some of our games are based on content that we
license from others (e.g., FIFA, Madden NFL, and Star Wars: The Old Republic). Our goal is to turn our core
intellectual properties into year-round businesses available on a range of platforms. Our products and services
may be purchased through physical and online retailers, platform providers such as console manufacturers and
mobile carriers via digital downloads, as well as directly through our own distribution platform, including online
portals such as Origin and Play4Free.
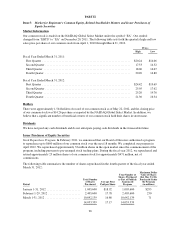
Financial Results
Total net revenue for the fiscal year ended March 31, 2012 was $4,143 million, up $554 million as compared to
the fiscal year ended March 31, 2011. At March 31, 2012, deferred net revenue associated with sales of online-
enabled packaged goods and digital content increased by $43 million as compared to March 31, 2011, directly
reducing the amount of reported net revenue during the fiscal year ended March 31, 2012. At March 31, 2011,
deferred net revenue associated with sales of online-enabled packaged goods and digital content increased by
$239 million as compared to March 31, 2010, directly reducing the amount of reported net revenue during the
fiscal year ended March 31, 2011. Without these changes in deferred net revenue, reported net revenue would
have increased by approximately $358 million during fiscal year 2012 as compared to fiscal year 2011. Net
revenue for fiscal year 2012 was driven by FIFA 12, Battlefield 3 and Madden NFL 12.
Net income for the fiscal year ended March 31, 2012 was $76 million as compared to a net loss of $276 million for the
fiscal year ended March 31, 2011. Diluted earnings per share for the fiscal year ended March 31, 2012 was $0.23 as
compared to a diluted loss per share of $0.84 for the fiscal year ended March 31, 2011. Net income increased for fiscal
year 2012 as compared to fiscal year 2011 primarily as a result of (1) a $455 million increase in gross profit due to a
decrease in the change in deferred net revenue related to certain online-enabled packaged goods and digital content and
a greater percentage of net revenue from EA studio and digital products, which have higher margins than our
co-publishing and distribution products and (2) a $145 million decrease in restructuring and other charges. The
increase in net income was partially offset by (1) a $106 million increase in marketing and sales costs, (2) a $59 million
increase in research and development costs, and (3) a $74 million increase in general and administrative costs.
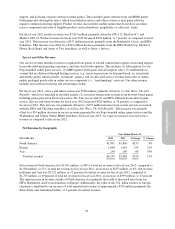
29