Electronic Arts 2012 Annual Report Download - page 127
Download and view the complete annual report
Please find page 127 of the 2012 Electronic Arts annual report below. You can navigate through the pages in the report by either clicking on the pages listed below, or by using the keyword search tool below to find specific information within the annual report.-
 1
1 -
2
-
3
-
4
-
5
-
6
-
7
-
8
-
9
-
10
-
11
-
12
-
13
-
14
-
15
-
16
-
17
-
18
-
19
-
20
-
21
-
22
-
23
-
24
-
25
-
26
-
27
-
28
-
29
-
30
-
31
-
32
-
33
-
34
-
35
-
36
-
37
-
38
-
39
-
40
-
41
-
42
-
43
-
44
-
45
-
46
-
47
-
48
-
49
-
50
-
51
-
52
-
53
-
54
-
55
-
56
-
57
-
58
-
59
-
60
-
61
-
62
-
63
-
64
-
65
-
66
-
67
-
68
-
69
-
70
-
71
-
72
-
73
-
74
-
75
-
76
-
77
-
78
-
79
-
80
-
81
-
82
-
83
-
84
-
85
-
86
-
87
-
88
-
89
-
90
-
91
-
92
-
93
-
94
-
95
-
96
-
97
-
98
-
99
-
100
-
101
-
102
-
103
-
104
-
105
-
106
-
107
-
108
-
109
-
110
-
111
-
112
-
113
-
114
-
115
-
116
-
 117
117 -
 118
118 -
 119
119 -
 120
120 -
 121
121 -
 122
122 -
 123
123 -
 124
124 -
 125
125 -
 126
126 -
 127
127 -
 128
128 -
 129
129 -
 130
130 -
 131
131 -
 132
132 -
 133
133 -
 134
134 -
 135
135 -
 136
136 -
 137
137 -
138
-
139
-
140
-
141
-
142
-
143
-
144
-
145
-
146
-
147
-
148
-
149
-
150
-
151
-
152
-
153
-
154
-
155
-
156
-
157
-
158
-
159
-
160
-
161
-
162
-
163
-
164
-
165
-
166
-
167
-
168
-
169
-
170
-
171
-
172
-
173
-
174
-
175
-
176
-
177
-
178
-
179
-
180
-
181
-
182
-
183
-
184
-
185
-
186
-
187
-
188
-
189
-
190
-
191
-
192
-
193
-
194
-
195
-
196
-
197
-
198
-
199
-
200
-
201
-
202
-
203
-
204
-
205
-
206
-
207
-
208
 |
 |

Annual Report
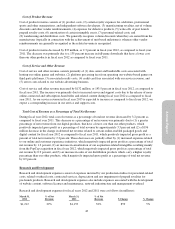
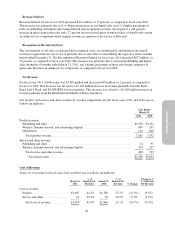
Cost of Product Revenue
Cost of product revenue consists of (1) product costs, (2) certain royalty expenses for celebrities, professional
sports and other organizations, and independent software developers, (3) manufacturing royalties, net of volume
discounts and other vendor reimbursements, (4) expenses for defective products, (5) write-offs of post launch
prepaid royalty costs, (6) amortization of certain intangible assets, (7) personnel-related costs, and
(8) warehousing and distribution costs. We generally recognize volume discounts when they are earned from the
manufacturer (typically in connection with the achievement of unit-based milestones); whereas other vendor
reimbursements are generally recognized as the related revenue is recognized.
Cost of product revenue decreased by $33 million, or 2.3 percent in fiscal year 2012, as compared to fiscal year
2011. The decrease was primarily due to a 135 percent increase in full-game downloads that have a lower cost
than our other products in fiscal year 2012 as compared to fiscal year 2011.
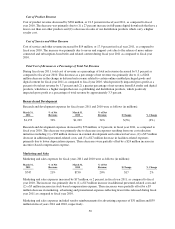
Cost of Service and Other Revenue
Cost of service and other revenue consists primarily of (1) data center and bandwidth costs associated with
hosting our online games and websites, (2) platform processing fees from operating our website-based games on
third party platforms, (3) associated royalty costs, (4) credit card fees associated with our service revenue, and
(5) server costs related to our website advertising business.
Cost of service and other revenue increased by $132 million, or 143.5 percent in fiscal year 2012, as compared to
fiscal year 2011. The increase was primarily due to increased server and support costs due to the release of more
online-connected and subscription-based titles and related content during fiscal year 2012 as compared to fiscal
year 2011. As our service revenue in fiscal year 2013 is expected to increase as compared to fiscal year 2012, we
expect a corresponding increase in our service and support costs.
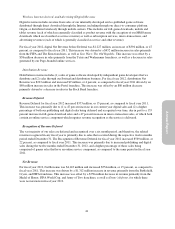
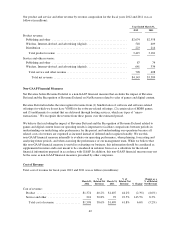
Total Cost of Revenue as a Percentage of Total Net Revenue
During fiscal year 2012, total cost of revenue as a percentage of total net revenue decreased by 3.2 percent as
compared to fiscal year 2011. This decrease as a percentage of net revenue was primarily due to (1) a greater
percentage of net revenue from our digital products, that have a lower cost than our other products, which
positively impacted gross profit as a percentage of total revenue by approximately 3.5 percent and (2) a $196
million decrease in the change in deferred net revenue related to certain online-enabled packaged goods and
digital content for fiscal year 2012 as compared to fiscal year 2011, which positively impacted gross profit as a
percent of total net revenue by 2.2 percent. These decreases are partially offset by (1) increased expenses related
to our online and customer experience initiatives, which negatively impacted gross profit as a percentage of total
net revenue by 1.2 percent, (2) an increase in amortization of our acquisition-related intangibles resulting mainly
from the PopCap acquisition in fiscal year 2012, which negatively impacted gross profit as a percentage of total
net revenue by 0.9 percent, and (3) an increase in sales of our distribution products which carry a higher royalty
percentage than our other products, which negatively impacted gross profit as a percentage of total net revenue
by 0.9 percent.
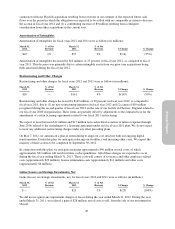
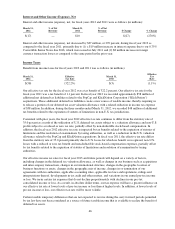
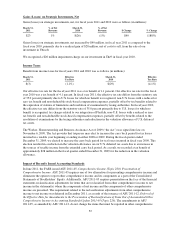
Research and Development
Research and development expenses consist of expenses incurred by our production studios for personnel-related
costs, related overhead costs, contracted services, depreciation and any impairment of prepaid royalties for
pre-launch products. Research and development expenses also include expenses associated with the development
of website content, software licenses and maintenance, network infrastructure and management overhead.
Research and development expenses for fiscal years 2012 and 2011 were as follows (in millions):
March 31,
2012
% of Net
Revenue
March 31,
2011
% of Net
Revenue $ Change % Change
$1,212 29% $1,153 32% $59 5%
43