Electronic Arts 2012 Annual Report Download - page 153
Download and view the complete annual report
Please find page 153 of the 2012 Electronic Arts annual report below. You can navigate through the pages in the report by either clicking on the pages listed below, or by using the keyword search tool below to find specific information within the annual report.-
 1
1 -
2
-
3
-
4
-
5
-
6
-
7
-
8
-
9
-
10
-
11
-
12
-
13
-
14
-
15
-
16
-
17
-
18
-
19
-
20
-
21
-
22
-
23
-
24
-
25
-
26
-
27
-
28
-
29
-
30
-
31
-
32
-
33
-
34
-
35
-
36
-
37
-
38
-
39
-
40
-
41
-
42
-
43
-
44
-
45
-
46
-
47
-
48
-
49
-
50
-
51
-
52
-
53
-
54
-
55
-
56
-
57
-
58
-
59
-
60
-
61
-
62
-
63
-
64
-
65
-
66
-
67
-
68
-
69
-
70
-
71
-
72
-
73
-
74
-
75
-
76
-
77
-
78
-
79
-
80
-
81
-
82
-
83
-
84
-
85
-
86
-
87
-
88
-
89
-
90
-
91
-
92
-
93
-
94
-
95
-
96
-
97
-
98
-
99
-
100
-
101
-
102
-
103
-
104
-
105
-
106
-
107
-
108
-
109
-
110
-
111
-
112
-
113
-
114
-
115
-
116
-
117
-
118
-
119
-
120
-
121
-
122
-
123
-
124
-
125
-
126
-
127
-
128
-
129
-
130
-
131
-
132
-
133
-
134
-
135
-
136
-
137
-
138
-
139
-
140
-
141
-
142
-
 143
143 -
 144
144 -
 145
145 -
 146
146 -
 147
147 -
 148
148 -
 149
149 -
 150
150 -
 151
151 -
 152
152 -
 153
153 -
 154
154 -
 155
155 -
 156
156 -
 157
157 -
 158
158 -
 159
159 -
 160
160 -
 161
161 -
 162
162 -
 163
163 -
164
-
165
-
166
-
167
-
168
-
169
-
170
-
171
-
172
-
173
-
174
-
175
-
176
-
177
-
178
-
179
-
180
-
181
-
182
-
183
-
184
-
185
-
186
-
187
-
188
-
189
-
190
-
191
-
192
-
193
-
194
-
195
-
196
-
197
-
198
-
199
-
200
-
201
-
202
-
203
-
204
-
205
-
206
-
207
-
208
 |
 |

Annual Report
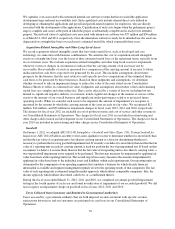
involve analysis of historical and future trends, can require extended periods of time to resolve, and are subject to
change from period to period. In all cases, actual results could differ materially from our estimates.
Cash, Cash Equivalents, Short-Term Investments and Marketable Equity Securities
Cash equivalents consist of highly liquid investments with insignificant interest rate risk and original or
remaining maturities of three months or less at the time of purchase.
Short-term investments consist of securities with original or remaining maturities of greater than three months at
the time of purchase and are accounted for as available-for-sale securities and are recorded at fair value. Short-
term investments are available for use in current operations or other activities such as capital expenditures and
business combinations.
Marketable equity securities consist of investments in common stock of publicly-traded companies and are
accounted for as available-for-sale securities and are recorded at fair value.
Unrealized gains and losses on our short-term investments and marketable equity securities are recorded as a
component of accumulated other comprehensive income in stockholders’ equity, net of tax, until either (1) the
security is sold, (2) the security has matured, or (3) we determine that the fair value of the security has declined
below its adjusted cost basis and the decline is other-than-temporary. Realized gains and losses on our short-term
investments and marketable equity securities are calculated based on the specific identification method and are
reclassified from accumulated other comprehensive income to interest and other income (expense), net, and gains
(losses) on strategic investments, net, respectively. Determining whether the decline in fair value is other-than-
temporary requires management judgment based on the specific facts and circumstances of each security. The
ultimate value realized on these securities is subject to market price volatility until they are sold.
Our short-term investments and marketable equity securities are evaluated for impairment quarterly. We consider
various factors in determining whether we should recognize an impairment charge, including the credit quality of
the issuer, the duration that the fair value has been less than the adjusted cost basis, severity of the impairment,
reason for the decline in value and potential recovery period, the financial condition and near-term prospects of
the investees, and our intent to sell and ability to hold the investment for a period of time sufficient to allow for
any anticipated recovery in market value, any contractual terms impacting the prepayment or settlement process,
as well as if we would be required to sell an investment due to liquidity or contractual reasons before its
anticipated recovery. If we conclude that an investment is other-than-temporarily impaired, we will recognize an
impairment charge at that time in our Consolidated Statements of Operations.
Inventories
Inventories consist of materials (including manufacturing royalties paid to console manufacturers), labor and freight-in
and are stated at the lower of cost (first-in, first-out method) or market value. We regularly review inventory quantities
on-hand. We write down inventory based on excess or obsolete inventories determined primarily by future anticipated
demand for our products. Inventory write-downs are measured as the difference between the cost of the inventory and
market value, based upon assumptions about future demand that are inherently difficult to assess. At the point of a loss
recognition, a new, lower cost basis for that inventory is established, and subsequent changes in facts and
circumstances do not result in the restoration or increase in that newly established basis.
Property and Equipment, Net
Property and equipment, net, are stated at cost. Depreciation is calculated using the straight-line method over the
following useful lives:
Buildings ..................................... 20to25years
Computer equipment and software ................. 3to5years
Furniture and equipment ......................... 3to5years
Leasehold improvements ......................... Lesser of the lease term or the estimated useful lives
of the improvements, generally 1 to 10 years
69