Electronic Arts 2012 Annual Report Download - page 42
Download and view the complete annual report
Please find page 42 of the 2012 Electronic Arts annual report below. You can navigate through the pages in the report by either clicking on the pages listed below, or by using the keyword search tool below to find specific information within the annual report.-
 1
1 -
2
-
3
-
4
-
5
-
6
-
7
-
8
-
9
-
10
-
11
-
12
-
13
-
14
-
15
-
16
-
17
-
18
-
19
-
20
-
21
-
22
-
23
-
24
-
25
-
26
-
27
-
28
-
29
-
30
-
31
-
 32
32 -
 33
33 -
 34
34 -
 35
35 -
 36
36 -
 37
37 -
 38
38 -
 39
39 -
 40
40 -
 41
41 -
 42
42 -
 43
43 -
 44
44 -
 45
45 -
 46
46 -
 47
47 -
 48
48 -
 49
49 -
 50
50 -
 51
51 -
 52
52 -
53
-
54
-
55
-
56
-
57
-
58
-
59
-
60
-
61
-
62
-
63
-
64
-
65
-
66
-
67
-
68
-
69
-
70
-
71
-
72
-
73
-
74
-
75
-
76
-
77
-
78
-
79
-
80
-
81
-
82
-
83
-
84
-
85
-
86
-
87
-
88
-
89
-
90
-
91
-
92
-
93
-
94
-
95
-
96
-
97
-
98
-
99
-
100
-
101
-
102
-
103
-
104
-
105
-
106
-
107
-
108
-
109
-
110
-
111
-
112
-
113
-
114
-
115
-
116
-
117
-
118
-
119
-
120
-
121
-
122
-
123
-
124
-
125
-
126
-
127
-
128
-
129
-
130
-
131
-
132
-
133
-
134
-
135
-
136
-
137
-
138
-
139
-
140
-
141
-
142
-
143
-
144
-
145
-
146
-
147
-
148
-
149
-
150
-
151
-
152
-
153
-
154
-
155
-
156
-
157
-
158
-
159
-
160
-
161
-
162
-
163
-
164
-
165
-
166
-
167
-
168
-
169
-
170
-
171
-
172
-
173
-
174
-
175
-
176
-
177
-
178
-
179
-
180
-
181
-
182
-
183
-
184
-
185
-
186
-
187
-
188
-
189
-
190
-
191
-
192
-
193
-
194
-
195
-
196
-
197
-
198
-
199
-
200
-
201
-
202
-
203
-
204
-
205
-
206
-
207
-
208
 |
 |
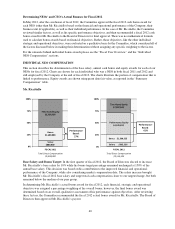
•Earnings Per Share: We achieved non-GAAP diluted earnings per share of $0.85, which was near the
top end of the guidance range that we provided in May 2011 of $0.70 to $0.90; this represents year-over-
year growth of 21%. Our diluted earnings per share range and achievement was highly dependent on the
timing of the successful launch of Star Wars: The Old Republic during fiscal 2012.
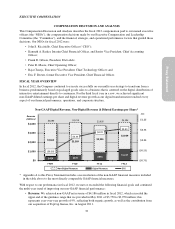
•Digital Revenue: Non-GAAP digital revenue is perhaps the most important financial goal that we set for
ourselves in fiscal 2012, because it represents the best measurement of the achievement of our strategic
transformation. For fiscal 2012, we were extremely pleased to report non-GAAP digital revenues of
$1,227 million, which exceeded the upper end of the guidance range that we provided in May 2011 of
$1,050 to $1,100 million; this represents year-over-year growth of 47%.
On a GAAP basis in fiscal 2012, we achieved net revenue of $4,143 million, diluted earnings per share of $0.23,
and digital revenue of $1,159 million. Appendix A to this Proxy Statement includes a reconciliation of the above-
mentioned non-GAAP financial measures to the most directly comparable GAAP financial measures, as well as a
discussion of why we believe these non-GAAP measures provide useful supplemental information regarding the
Company’s performance.
We also set and achieved a number of operational and structural goals in fiscal 2012. These were:
•Digital Expansion: We expanded the distribution of key products and our core brands into new markets,
including mobile gaming on smart phones and social gaming on the internet. Recent strategic
acquisitions, including PopCap, helped to drive that digital expansion. The efforts to grow and prioritize
our digital distribution of products were aided by the integration of the business units that develop games
specifically for digital distribution into our “EA Labels” game development organization.
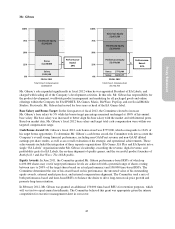
•Star Wars: The Old Republic:We successfully launched the most ambitious online game service in our
history, Star Wars: The Old Republic, at the end of December 2011.
•Origin: We devoted significant resources to build and launch our direct-to-consumer digital service
platform, known as Origin, and made investments in the technological infrastructure that will support our
games, services, and consumer relationships. As a result, our online community and commerce service
expanded rapidly in fiscal 2012, and by the end of the fiscal year, Origin had approximately 11 million
customers installed to date and had generated approximately $150 million in fiscal 2012 non-GAAP
revenue.
•Chart Position: We set a goal for fiscal 2012 to optimize our chart position in Western markets (United
States, Canada and Europe) for our packaged goods launches. We had major successes on this front, not
only maintaining our position as the number one publisher in Western markets for high-definition games,
but gaining overall share and placing five of our titles on the top-20 bestsellers list and two of our titles in
the top-five bestsellers list in fiscal 2012.
•Organizational Health: We focused extensively on hiring and retaining a leadership team that can
navigate our digital transformation, including the addition of an Executive Vice President, Digital and a
Chief Technology Officer. Overall, our voluntary attrition rate dropped in fiscal 2012 as compared to
fiscal 2011 and we have significantly increased our focus on college recruiting and hiring digital talent
into the Company.
These achievements provide important context for the fiscal 2012 compensation decisions for our NEOs, as
discussed below.
COMPENSATION PRINCIPLES AND STRUCTURE
The basic principles and structure of our compensation programs did not change in fiscal 2012. Our
compensation programs are designed to motivate our NEOs to achieve financial, strategic, and operational
objectives and create long-term stockholder value. We structure and review our NEO compensation in
34