Electronic Arts 2012 Annual Report Download - page 176
Download and view the complete annual report
Please find page 176 of the 2012 Electronic Arts annual report below. You can navigate through the pages in the report by either clicking on the pages listed below, or by using the keyword search tool below to find specific information within the annual report.-
 1
1 -
2
-
3
-
4
-
5
-
6
-
7
-
8
-
9
-
10
-
11
-
12
-
13
-
14
-
15
-
16
-
17
-
18
-
19
-
20
-
21
-
22
-
23
-
24
-
25
-
26
-
27
-
28
-
29
-
30
-
31
-
32
-
33
-
34
-
35
-
36
-
37
-
38
-
39
-
40
-
41
-
42
-
43
-
44
-
45
-
46
-
47
-
48
-
49
-
50
-
51
-
52
-
53
-
54
-
55
-
56
-
57
-
58
-
59
-
60
-
61
-
62
-
63
-
64
-
65
-
66
-
67
-
68
-
69
-
70
-
71
-
72
-
73
-
74
-
75
-
76
-
77
-
78
-
79
-
80
-
81
-
82
-
83
-
84
-
85
-
86
-
87
-
88
-
89
-
90
-
91
-
92
-
93
-
94
-
95
-
96
-
97
-
98
-
99
-
100
-
101
-
102
-
103
-
104
-
105
-
106
-
107
-
108
-
109
-
110
-
111
-
112
-
113
-
114
-
115
-
116
-
117
-
118
-
119
-
120
-
121
-
122
-
123
-
124
-
125
-
126
-
127
-
128
-
129
-
130
-
131
-
132
-
133
-
134
-
135
-
136
-
137
-
138
-
139
-
140
-
141
-
142
-
143
-
144
-
145
-
146
-
147
-
148
-
149
-
150
-
151
-
152
-
153
-
154
-
155
-
156
-
157
-
158
-
159
-
160
-
161
-
162
-
163
-
164
-
165
-
 166
166 -
 167
167 -
 168
168 -
 169
169 -
 170
170 -
 171
171 -
 172
172 -
 173
173 -
 174
174 -
 175
175 -
 176
176 -
 177
177 -
 178
178 -
 179
179 -
 180
180 -
 181
181 -
 182
182 -
 183
183 -
 184
184 -
 185
185 -
 186
186 -
187
-
188
-
189
-
190
-
191
-
192
-
193
-
194
-
195
-
196
-
197
-
198
-
199
-
200
-
201
-
202
-
203
-
204
-
205
-
206
-
207
-
208
 |
 |

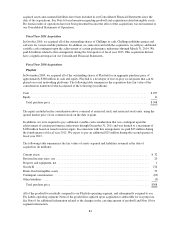
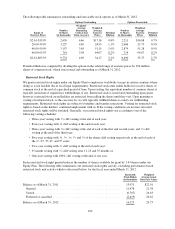
Deferred net revenue (other) includes the deferral of subscription revenue, deferrals related to our Switzerland
distribution business, advertising revenue, licensing arrangements and other revenue for which revenue
recognition criteria has not been met.
Deferred Net Revenue (Packaged Goods and Digital Content)
Deferred net revenue (packaged goods and digital content) was $1,048 million and $1,005 million as of
March 31, 2012 and 2011, respectively. Deferred net revenue (packaged goods and digital content) includes the
unrecognized revenue from (1) bundled sales of certain online-enabled packaged goods and digital content for
which either we do not have VSOE for the online service that we provide in connection with the sale of the
software or we have an obligation to provide future incremental unspecified digital content, (2) certain packaged
goods sales of MMO role-playing games, and (3) sales of certain incremental content associated with our core
subscription services that can only be played online, which are types of “micro-transactions.” We recognize
revenue from sales of online-enabled packaged goods and digital content for which (1) we do not have VSOE for
the online service that we provided in connection with the sale and (2) we have an obligation to deliver
incremental unspecified digital content in the future without an additional fee on a straight-line basis generally
over an estimated six-month period beginning in the month after delivery. However, we expense the cost of
revenue related to these transactions during the period in which the product is delivered (rather than on a deferred
basis).
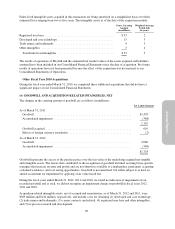
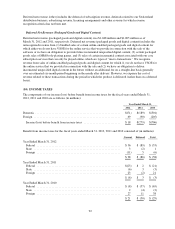
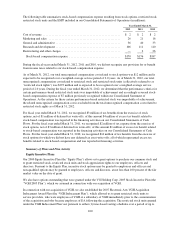
(10) INCOME TAXES
The components of our income (loss) before benefit from income taxes for the fiscal years ended March 31,
2012, 2011 and 2010 are as follows (in millions):
Year Ended March 31,
2012 2011 2010
Domestic .......................................................... $(51) $(189) $(501)
Foreign ........................................................... 69 (90) (205)
Income (loss) before benefit from income taxes ......................... $18 $(279) $(706)
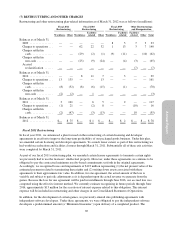
Benefit from income taxes for the fiscal years ended March 31, 2012, 2011 and 2010 consisted of (in millions):
Current Deferred Total
Year Ended March 31, 2012
Federal ......................................................... $36 $ (89) $ (53)
State ........................................................... 3 (2) 1
Foreign ......................................................... (11) 5 (6)
$ 28 $ (86) $ (58)
Year Ended March 31, 2011
Federal ......................................................... $(23) $ 2 $ (21)
State ........................................................... (6) 3 (3)
Foreign ......................................................... 23 (2) 21
$ (6) $ 3 $ (3)
Year Ended March 31, 2010
Federal ......................................................... $ (8) $ (57) $ (65)
State ........................................................... 2 (4) (2)
Foreign ......................................................... 27 11 38
$ 21 $ (50) $ (29)
92