Electronic Arts 2012 Annual Report Download - page 138
Download and view the complete annual report
Please find page 138 of the 2012 Electronic Arts annual report below. You can navigate through the pages in the report by either clicking on the pages listed below, or by using the keyword search tool below to find specific information within the annual report.-
 1
1 -
2
-
3
-
4
-
5
-
6
-
7
-
8
-
9
-
10
-
11
-
12
-
13
-
14
-
15
-
16
-
17
-
18
-
19
-
20
-
21
-
22
-
23
-
24
-
25
-
26
-
27
-
28
-
29
-
30
-
31
-
32
-
33
-
34
-
35
-
36
-
37
-
38
-
39
-
40
-
41
-
42
-
43
-
44
-
45
-
46
-
47
-
48
-
49
-
50
-
51
-
52
-
53
-
54
-
55
-
56
-
57
-
58
-
59
-
60
-
61
-
62
-
63
-
64
-
65
-
66
-
67
-
68
-
69
-
70
-
71
-
72
-
73
-
74
-
75
-
76
-
77
-
78
-
79
-
80
-
81
-
82
-
83
-
84
-
85
-
86
-
87
-
88
-
89
-
90
-
91
-
92
-
93
-
94
-
95
-
96
-
97
-
98
-
99
-
100
-
101
-
102
-
103
-
104
-
105
-
106
-
107
-
108
-
109
-
110
-
111
-
112
-
113
-
114
-
115
-
116
-
117
-
118
-
119
-
120
-
121
-
122
-
123
-
124
-
125
-
126
-
127
-
 128
128 -
 129
129 -
 130
130 -
 131
131 -
 132
132 -
 133
133 -
 134
134 -
 135
135 -
 136
136 -
 137
137 -
 138
138 -
 139
139 -
 140
140 -
 141
141 -
 142
142 -
 143
143 -
 144
144 -
 145
145 -
 146
146 -
 147
147 -
 148
148 -
149
-
150
-
151
-
152
-
153
-
154
-
155
-
156
-
157
-
158
-
159
-
160
-
161
-
162
-
163
-
164
-
165
-
166
-
167
-
168
-
169
-
170
-
171
-
172
-
173
-
174
-
175
-
176
-
177
-
178
-
179
-
180
-
181
-
182
-
183
-
184
-
185
-
186
-
187
-
188
-
189
-
190
-
191
-
192
-
193
-
194
-
195
-
196
-
197
-
198
-
199
-
200
-
201
-
202
-
203
-
204
-
205
-
206
-
207
-
208
 |
 |

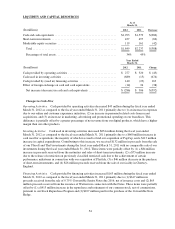
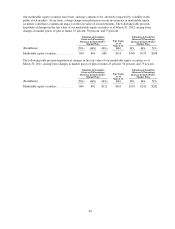
LIQUIDITY AND CAPITAL RESOURCES
As of
March 31,
Decrease(In millions) 2012 2011
Cash and cash equivalents .......................................... $1,293 $1,579 $(286)
Short-term investments ............................................ 437 497 (60)
Marketable equity securities ........................................ 119 161 (42)
Total ......................................................... $1,849 $2,237 $(388)
Percentage of total assets ......................................... 34% 45%
Year Ended
March 31,
Change(In millions) 2012 2011
Cash provided by operating activities ................................. $ 277 $ 320 $ (43)
Cash used in investing activities ..................................... (689) (15) (674)
Cash provided by (used in) financing activities ......................... 140 (23) 163
Effect of foreign exchange on cash and cash equivalents .................. (14) 24 (38)
Net increase (decrease) in cash and cash equivalents ................... $ (286) $ 306 $(592)
Changes in Cash Flow
Operating Activities. Cash provided by operating activities decreased $43 million during the fiscal year ended
March 31, 2012 as compared to the fiscal year ended March 31, 2011 primarily due to (1) an increase in expenses
due to our online and customer experience initiatives, (2) an increase in personnel-related costs from recent
acquisitions, and (3) an increase in marketing, advertising and promotional spending on our franchises. This
difference is partially offset by a greater percentage of net revenue from our digital products, which have a higher
margin than our other products.
Investing Activities. Cash used in investing activities increased $674 million during the fiscal year ended
March 31, 2012 as compared to the fiscal year ended March 31, 2011 primarily due to a $660 million increase in
cash used for acquisitions, the majority of which was used to fund our acquisition of PopCap, and a $113 million
increase in capital expenditures. Contributing to this increase, we received $132 million in proceeds from the sale
of our Ubisoft and The9 investments during the fiscal year ended March 31, 2011 with no comparable sale of our
investments during the fiscal year ended March 31, 2012. These items were partially offset by (1) a $84 million
increase in proceeds received from the maturities and sales of short-term investments, (2) a $75 million increase
due to the release of restriction on previously classified restricted cash due to the achievement of certain
performance milestones in connection with our acquisition of Playfish, (3) a $46 million decrease in the purchase
of short-term investments, and (4) $26 million proceeds received from the sale of our facility in Chertsey,
England.
Financing Activities. Cash provided by financing activities increased $163 million during the fiscal year ended
March 31, 2012 as compared to the fiscal year ended March 31, 2011 primarily due to (1) $617 million in
proceeds received from the sale of 0.75% Convertible Senior Notes due 2016, net of issuance costs and (2) $65
million proceeds received from the issuance of Warrants in connection with the Notes. These items were partially
offset by (1) a $413 million increase in the repurchase and retirement of our common stock, net of commissions,
pursuant to our Stock Repurchase Program and (2) $107 million paid for the purchase of the Convertible Note
Hedge.
54