Electronic Arts 2012 Annual Report Download - page 44
Download and view the complete annual report
Please find page 44 of the 2012 Electronic Arts annual report below. You can navigate through the pages in the report by either clicking on the pages listed below, or by using the keyword search tool below to find specific information within the annual report.-
 1
1 -
2
-
3
-
4
-
5
-
6
-
7
-
8
-
9
-
10
-
11
-
12
-
13
-
14
-
15
-
16
-
17
-
18
-
19
-
20
-
21
-
22
-
23
-
24
-
25
-
26
-
27
-
28
-
29
-
30
-
31
-
32
-
33
-
 34
34 -
 35
35 -
 36
36 -
 37
37 -
 38
38 -
 39
39 -
 40
40 -
 41
41 -
 42
42 -
 43
43 -
 44
44 -
 45
45 -
 46
46 -
 47
47 -
 48
48 -
 49
49 -
 50
50 -
 51
51 -
 52
52 -
 53
53 -
 54
54 -
55
-
56
-
57
-
58
-
59
-
60
-
61
-
62
-
63
-
64
-
65
-
66
-
67
-
68
-
69
-
70
-
71
-
72
-
73
-
74
-
75
-
76
-
77
-
78
-
79
-
80
-
81
-
82
-
83
-
84
-
85
-
86
-
87
-
88
-
89
-
90
-
91
-
92
-
93
-
94
-
95
-
96
-
97
-
98
-
99
-
100
-
101
-
102
-
103
-
104
-
105
-
106
-
107
-
108
-
109
-
110
-
111
-
112
-
113
-
114
-
115
-
116
-
117
-
118
-
119
-
120
-
121
-
122
-
123
-
124
-
125
-
126
-
127
-
128
-
129
-
130
-
131
-
132
-
133
-
134
-
135
-
136
-
137
-
138
-
139
-
140
-
141
-
142
-
143
-
144
-
145
-
146
-
147
-
148
-
149
-
150
-
151
-
152
-
153
-
154
-
155
-
156
-
157
-
158
-
159
-
160
-
161
-
162
-
163
-
164
-
165
-
166
-
167
-
168
-
169
-
170
-
171
-
172
-
173
-
174
-
175
-
176
-
177
-
178
-
179
-
180
-
181
-
182
-
183
-
184
-
185
-
186
-
187
-
188
-
189
-
190
-
191
-
192
-
193
-
194
-
195
-
196
-
197
-
198
-
199
-
200
-
201
-
202
-
203
-
204
-
205
-
206
-
207
-
208
 |
 |

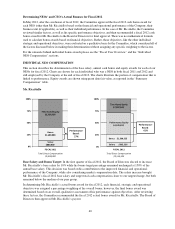
Annual Equity Awards
The Committee targeted the fiscal 2012 equity awards to our NEOs to be comprised of 50% performance-based
RSUs to further align the compensation of our NEOs with Company performance and stockholders’ interests,
and 50% time-based RSUs to promote retention of our leadership team. In June 2011, the Committee granted
each of our NEOs (excluding Mr. Barker and Mr. Taneja) a target mix of 50% time-based RSUs and 50%
performance-based RSUs.
The actual number of performance-based RSUs earned will be determined by the Committee and range from zero
to 200% of the target award based on the Company’s total stockholder return (“TSR”) relative to the performance
of each of the companies in the NASDAQ-100 Index on April 3, 2011 (“NASDAQ-100”) over one-year (fiscal
2012), two-year (fiscal 2012 through 2013), and three-year (fiscal 2012 through 2014) measurement periods.
TSR is determined based on a 90-day trailing average of the closing stock prices of the NASDAQ-100 at the end
of each measurement period as compared to the 90-day trailing average of the closing stock prices of the
NASDAQ-100 at the beginning of the measurement period. For each measurement period, the Company’s TSR
must be at the 60th percentile of the TSR of companies in the NASDAQ-100 in order for 100% of the target
award to vest. This requires the Company to outperform the majority of companies in the NASDAQ-100 for the
targeted number of shares to vest. If our TSR is above or below the 60th percentile, the number of shares that
vest will increase by 3% for each percentile above the 60th, or decrease by 2% for each percentile below the 60th.
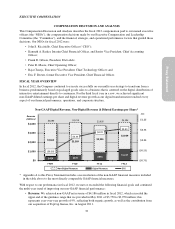
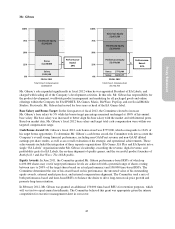
Our NEOs were eligible to earn up to one-third of the performance-based RSUs granted in June 2011, based on
the Company’s TSR for fiscal 2012. Despite strong operational results, the Company’s share price was flat year-
over-year, moving from $17.79 per share to $17.76 per share (in each case based on a 90-day trailing average
from the last day of fiscal 2012 and fiscal 2011, respectively). This resulted in a TSR of -0.2% and ranked the
Company at the 42nd percentile compared to the companies in the NASDAQ-100. Based on the terms of the
performance-based RSUs described above, 64% of the target shares for the one-year TSR measurement period
vested in May 2012 out of the potential maximum vesting of 200% of the target shares.
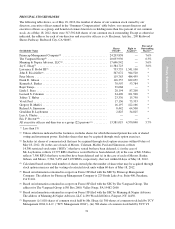
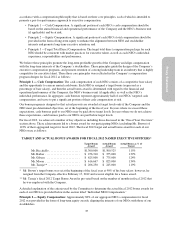
FY12 Target
Performance
Shares
Performance
Shares Vested
Based on
Actual FY12
Performance*
Mr. Riccitiello .............................. 41,666 26,666
Mr. Gibeau ................................. 33,333 21,333
Mr. Moore ................................. 21,666 13,866
*Mr. Brown’s target performance shares for fiscal 2012 performance were 16,666; however, his unvested
awards were cancelled as of February 17, 2012, the effective date of his resignation.
An additional one-third of the performance-based RSUs granted in June 2011 are eligible to be earned in each of
the second performance period (fiscal 2012 through fiscal 2013) and third performance period (fiscal 2012
through fiscal 2014). Additional details are provided below in the section titled “Compensation Programs and
Plans.”
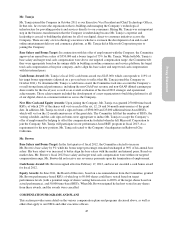
Retention Equity Awards
Over the last few years, and with increased intensity during fiscal 2012, the Company has experienced significant
recruiting pressure from our peer companies, start-up companies, and large, diversified technology and
entertainment companies. During fiscal 2012, a number of executives, including four of our executive officers,
left the Company for positions in other organizations. In February 2012, the Committee looked at a number of
alternatives to help promote retention, and ultimately decided to grant additional time-based RSUs to a number
of key employees, including three NEOs (Mr. Gibeau, Mr. Moore and Mr. Barker). The time-based RSUs will
vest 50% per year over two years.
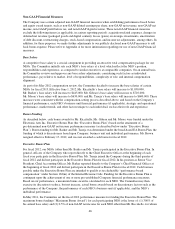
Principle 3 — Target Total Direct Compensation: We awarded total direct compensation to our NEOs for
fiscal 2012 consistent with market practices, each NEO’s role and experience, and business conditions. Total
direct compensation has three components: base salary, annual cash bonus, and equity awards.
36