Electronic Arts 2012 Annual Report Download - page 66
Download and view the complete annual report
Please find page 66 of the 2012 Electronic Arts annual report below. You can navigate through the pages in the report by either clicking on the pages listed below, or by using the keyword search tool below to find specific information within the annual report.-
 1
1 -
2
-
3
-
4
-
5
-
6
-
7
-
8
-
9
-
10
-
11
-
12
-
13
-
14
-
15
-
16
-
17
-
18
-
19
-
20
-
21
-
22
-
23
-
24
-
25
-
26
-
27
-
28
-
29
-
30
-
31
-
32
-
33
-
34
-
35
-
36
-
37
-
38
-
39
-
40
-
41
-
42
-
43
-
44
-
45
-
46
-
47
-
48
-
49
-
50
-
51
-
52
-
53
-
54
-
55
-
 56
56 -
 57
57 -
 58
58 -
 59
59 -
 60
60 -
 61
61 -
 62
62 -
 63
63 -
 64
64 -
 65
65 -
 66
66 -
 67
67 -
 68
68 -
 69
69 -
 70
70 -
 71
71 -
 72
72 -
 73
73 -
 74
74 -
 75
75 -
 76
76 -
77
-
78
-
79
-
80
-
81
-
82
-
83
-
84
-
85
-
86
-
87
-
88
-
89
-
90
-
91
-
92
-
93
-
94
-
95
-
96
-
97
-
98
-
99
-
100
-
101
-
102
-
103
-
104
-
105
-
106
-
107
-
108
-
109
-
110
-
111
-
112
-
113
-
114
-
115
-
116
-
117
-
118
-
119
-
120
-
121
-
122
-
123
-
124
-
125
-
126
-
127
-
128
-
129
-
130
-
131
-
132
-
133
-
134
-
135
-
136
-
137
-
138
-
139
-
140
-
141
-
142
-
143
-
144
-
145
-
146
-
147
-
148
-
149
-
150
-
151
-
152
-
153
-
154
-
155
-
156
-
157
-
158
-
159
-
160
-
161
-
162
-
163
-
164
-
165
-
166
-
167
-
168
-
169
-
170
-
171
-
172
-
173
-
174
-
175
-
176
-
177
-
178
-
179
-
180
-
181
-
182
-
183
-
184
-
185
-
186
-
187
-
188
-
189
-
190
-
191
-
192
-
193
-
194
-
195
-
196
-
197
-
198
-
199
-
200
-
201
-
202
-
203
-
204
-
205
-
206
-
207
-
208
 |
 |

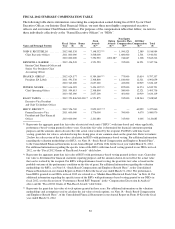
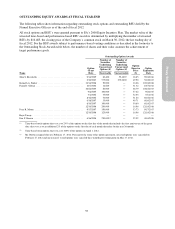
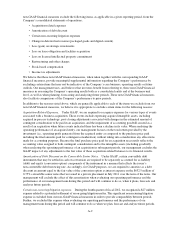
Outstanding Stock Awards
Time-Based Vesting
Awards
Performance-Based Vesting
Awards
Name
Grant
Date
Number of
Shares or
Units of
Stock
That Have
Not
Vested
(#)
Market
Value of
Shares
or Units
of Stock
That
have
Not
Vested
($)
Equity
Incentive
Plan
Awards:
Number of
Unearned
Shares, Units
or Other
Rights That
Have Not
Vested
(#)
Equity
Incentive
Plan Awards:
Market or
Payout Value
of Unearned
Shares, Units
or Other
Rights That
Have Not
Vested ($)
John S. Riccitiello ..................................... 5/16/2008 — — 66,667(1) 1,099,006
6/16/2011 — — 125,000(2) 2,060,625
9/16/2009 129,000(3) 2,126,565 — —
5/18/2010 133,334(3) 2,198,011 — —
6/16/2011 125,000(4) 2,060,625 — —
Kenneth A. Barker .................................... 5/16/2008 — — 16,667(1) 274,755
6/16/2008 1,250(5) 20,606 — —
6/16/2009 2,534(3) 41,773 — —
5/17/2010 26,667(3) 439,605 — —
6/16/2011 37,500(4) 618,188 — —
2/16/2012 40,000(6) 659,400 — —
Frank D. Gibeau ...................................... 5/16/2008 — — 41,667(1) 686,880
6/16/2011 — — 100,000(2) 1,648,500
6/16/2008 3,125(5) 51,516 — —
6/16/2009 6,334(3) 104,416 — —
9/16/2009 40,000(3) 659,400 — —
5/17/2010 86,667(3) 1,428,706 — —
6/16/2011 100,000(4) 1,648,500 — —
2/16/2012 150,000(6) 2,472,750 — —
Peter R. Moore ....................................... 5/16/2008 — — 41,667(1) 686,880
6/16/2011 — — 65,000(2) 1,071,525
6/16/2008 3,125(5) 51,516 — —
6/16/2009 6,334(3) 104,416 — —
9/16/2009 40,000(3) 659,400 — —
5/17/2010 86,667(3) 1,428,705 — —
6/16/2011 65,000(4) 1,071,525 — —
2/16/2012 100,000(6) 1,648,500 — —
Rajat Taneja ......................................... 10/17/2011 25,000(7) 412,125 — —
10/17/2011 250,000(8) 4,121,250 — —
Eric F. Brown(9) ....................................... — — — — —
(1) Represents RSUs with performance-based vesting at the threshold target achievement level of one-third of the RSU award granted. The
awards may vest in three equal amounts, with the vesting of each amount contingent upon EA’s achievement of three progressively
higher adjusted non-GAAP net income targets (as measured on a trailing four-quarter basis). On the grant date, we assumed that
one-third of the awards would vest based upon achievement of the first non-GAAP net income target. During the fiscal year ended
March 31, 2012, we determined that the performance criteria for these awards was improbable of achievement. For additional
information, see Note 14, “Stock-Based Compensation and Employee Benefit Plans”, to the Consolidated Financial Statements in our
Annual Report on Form 10-K for the fiscal year ended March 31, 2012.
(2) Represents RSUs with performance-based vesting at the target achievement level. The performance-based RSUs granted to our NEOs
in fiscal 2012 are referred to as “Market-Based Restricted Stock Units” in Note 14, “Stock-Based Compensation and Employee Benefit
Plans”, to the Consolidated Financial Statements in our Annual Report on Form 10-K for the fiscal year ended March 31, 2012. The
number of performance-based RSUs that can be earned will be determined by the Committee and range from zero to 200% of the target
award based on the Company’s TSR relative to the performance of each of the companies in the NASDAQ-100 over one-year (fiscal
2012), two-year (fiscal 2012 through 2013), and three-year (fiscal 2012 through 2014) measurement periods. TSR is determined based
on a 90-day trailing average of the closing stock prices of the NASDAQ-100 at the end of each measurement period as compared to the
90-day trailing average of the closing stock prices of the NASDAQ-100 at the beginning of the measurement period. For each
measurement period, the Company’s TSR must be at the 60th percentile of the TSR of companies in the NASDAQ-100 in order for
100% of the target award to vest. This requires the Company to outperform the majority of companies in the NASDAQ-100 for the
targeted number of shares to vest. If our TSR is above or below the 60th percentile, the number of shares that vest will increase by 3%
for each percentile above the 60th, or decrease by 2% for each percentile below the 60th.
(3) Time-based RSUs with one-third of the units vesting on each of the first three anniversaries of the grant date.
58