Electronic Arts 2012 Annual Report Download - page 63
Download and view the complete annual report
Please find page 63 of the 2012 Electronic Arts annual report below. You can navigate through the pages in the report by either clicking on the pages listed below, or by using the keyword search tool below to find specific information within the annual report.-
 1
1 -
2
-
3
-
4
-
5
-
6
-
7
-
8
-
9
-
10
-
11
-
12
-
13
-
14
-
15
-
16
-
17
-
18
-
19
-
20
-
21
-
22
-
23
-
24
-
25
-
26
-
27
-
28
-
29
-
30
-
31
-
32
-
33
-
34
-
35
-
36
-
37
-
38
-
39
-
40
-
41
-
42
-
43
-
44
-
45
-
46
-
47
-
48
-
49
-
50
-
51
-
52
-
 53
53 -
 54
54 -
 55
55 -
 56
56 -
 57
57 -
 58
58 -
 59
59 -
 60
60 -
 61
61 -
 62
62 -
 63
63 -
 64
64 -
 65
65 -
 66
66 -
 67
67 -
 68
68 -
 69
69 -
 70
70 -
 71
71 -
 72
72 -
 73
73 -
74
-
75
-
76
-
77
-
78
-
79
-
80
-
81
-
82
-
83
-
84
-
85
-
86
-
87
-
88
-
89
-
90
-
91
-
92
-
93
-
94
-
95
-
96
-
97
-
98
-
99
-
100
-
101
-
102
-
103
-
104
-
105
-
106
-
107
-
108
-
109
-
110
-
111
-
112
-
113
-
114
-
115
-
116
-
117
-
118
-
119
-
120
-
121
-
122
-
123
-
124
-
125
-
126
-
127
-
128
-
129
-
130
-
131
-
132
-
133
-
134
-
135
-
136
-
137
-
138
-
139
-
140
-
141
-
142
-
143
-
144
-
145
-
146
-
147
-
148
-
149
-
150
-
151
-
152
-
153
-
154
-
155
-
156
-
157
-
158
-
159
-
160
-
161
-
162
-
163
-
164
-
165
-
166
-
167
-
168
-
169
-
170
-
171
-
172
-
173
-
174
-
175
-
176
-
177
-
178
-
179
-
180
-
181
-
182
-
183
-
184
-
185
-
186
-
187
-
188
-
189
-
190
-
191
-
192
-
193
-
194
-
195
-
196
-
197
-
198
-
199
-
200
-
201
-
202
-
203
-
204
-
205
-
206
-
207
-
208
 |
 |

Proxy Statement
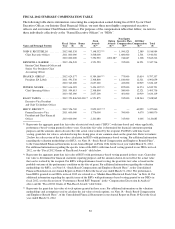
FISCAL 2012 GRANTS OF PLAN-BASED AWARDS TABLE
The following table shows information regarding non-equity incentive and equity plan-based awards granted to
the named executive officers during fiscal 2012.
Name
Grant
Date(1)
Approval
Date(1)
Estimated Future Payouts
Under Non-Equity
Incentive Plan Awards(2)
Estimated Future
Payouts Under Equity
Incentive Plan
Awards(3)
All Other
Stock
Awards:
Number of
Shares of
Stock or
Units (#)(4)
Grant
Date Fair
Value of
Stock
Awards
($)(5)
Target
($)
Maximum
($)
Target
(#)
Maximum
(#)
John S. Riccitiello . . . — — 1,300,000 2,640,000 — — — —
6/16/2011 5/27/2011 — — 125,000 250,000 — 4,345,832
6/16/2011 5/27/2011 — — — — 125,000(6) 2,802,500
Kenneth A. Barker . . — — 256,310 — — — — —
6/16/2011 5/26/2011 — — — — 37,500(6) 840,750
2/16/2012 2/8/2012 — — — — 40,000(7) 710,800
Frank D. Gibeau .... — — 625,000 1,420,000 — — — —
6/16/2011 5/26/2011 — — 100,000 200,000 — 3,476,666
6/16/2011 5/26/2011 — — — — 100,000(6) 2,242,000
2/16/2012 2/8/2012 — — — — 150,000(7) 2,665,500
Peter R. Moore ..... — — 616,667 1,420,000 — — — —
6/16/2011 5/26/2011 — — 65,000 130,000 — 2,259,832
6/16/2011 5/26/2011 — — — — 65,000(6) 1,457,300
2/16/2012 2/8/2012 — — — — 100,000(7) 1,777,000
Rajat Taneja ....... — — 206,250 — — — — —
10/17/2011 9/12/2011 — — — — 250,000(8) 5,956,250
10/17/2011 9/12/2011 — — — — 25,000(9) 595,625
Eric F. Brown(10) .... 6/16/2011 5/26/2011 — — 50,000 100,000 — 1,738,332
6/16/2011 5/26/2011 — — — — 50,000(6) 1,121,000
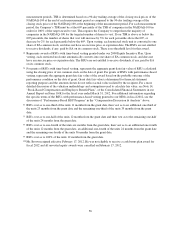
(1) Each grant was approved on the approval date indicated above by our Executive Compensation and
Leadership Committee, or the Board of Directors with respect to grants to Mr. Riccitiello, for grant on the
specific grant date indicated above. For more information regarding our grant date policy, see “Equity Awards
Grant Practices” in the “Compensation Discussion and Analysis” above.
(2) The amounts shown represent the target and maximum amount of potential cash bonus plan awards provided
for under the Executive Bonus Plan for Messrs. Riccitiello, Gibeau and Moore. The target amounts are
pre-established as a percentage of salary and the maximum amounts represent the greatest payout that could
have been made if the pre-established performance level was met or exceeded. Mr. Barker and Mr. Taneja
were eligible to participate in the EA Bonus Plan for fiscal 2012. Mr. Barker’s target bonus amount for fiscal
2012 was 60% of his annual base salary and Mr. Taneja’s target bonus amount for fiscal 2012 was 75% of his
annual base salary, pro-rated based on the number of months in fiscal 2012 that he was employed with the
Company. For more information regarding the bonuses paid to our NEOs in fiscal 2012 and an explanation of
the amount of salary and bonus in proportion to total compensation, see the sections titled “Compensation
Principles and Structure”, “Individual NEO Compensation”, “Executive Bonus Plan”, and “EA Bonus Plan”
in the “Compensation Discussion and Analysis” above. There is no threshold level for this award.
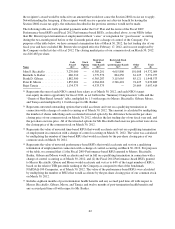
(3) Represents awards of RSUs with performance-based vesting granted under our 2000 Equity Incentive Plan.
The performance-based RSUs granted to our NEOs in fiscal 2012 are referred to as “Market-Based Restricted
Stock Units” in Note 14, “Stock-Based Compensation and Employee Benefit Plans” to the Consolidated
Financial Statements in our Annual Report on Form 10-K for the fiscal year ended March 31, 2012. The
number of performance-based RSUs that can be earned will be determined by the Committee and range from
zero to 200% of the target award based on the Company’s total stockholder return (“TSR”) relative to the
performance of each of the companies in the NASDAQ-100 Index on April 3, 2011 (“NASDAQ-100”) over
one-year (fiscal 2012), two-year (fiscal 2012 through 2013), and three-year (fiscal 2012 through 2014)
55