Electronic Arts 2012 Annual Report Download - page 45
Download and view the complete annual report
Please find page 45 of the 2012 Electronic Arts annual report below. You can navigate through the pages in the report by either clicking on the pages listed below, or by using the keyword search tool below to find specific information within the annual report.-
 1
1 -
2
-
3
-
4
-
5
-
6
-
7
-
8
-
9
-
10
-
11
-
12
-
13
-
14
-
15
-
16
-
17
-
18
-
19
-
20
-
21
-
22
-
23
-
24
-
25
-
26
-
27
-
28
-
29
-
30
-
31
-
32
-
33
-
34
-
 35
35 -
 36
36 -
 37
37 -
 38
38 -
 39
39 -
 40
40 -
 41
41 -
 42
42 -
 43
43 -
 44
44 -
 45
45 -
 46
46 -
 47
47 -
 48
48 -
 49
49 -
 50
50 -
 51
51 -
 52
52 -
 53
53 -
 54
54 -
 55
55 -
56
-
57
-
58
-
59
-
60
-
61
-
62
-
63
-
64
-
65
-
66
-
67
-
68
-
69
-
70
-
71
-
72
-
73
-
74
-
75
-
76
-
77
-
78
-
79
-
80
-
81
-
82
-
83
-
84
-
85
-
86
-
87
-
88
-
89
-
90
-
91
-
92
-
93
-
94
-
95
-
96
-
97
-
98
-
99
-
100
-
101
-
102
-
103
-
104
-
105
-
106
-
107
-
108
-
109
-
110
-
111
-
112
-
113
-
114
-
115
-
116
-
117
-
118
-
119
-
120
-
121
-
122
-
123
-
124
-
125
-
126
-
127
-
128
-
129
-
130
-
131
-
132
-
133
-
134
-
135
-
136
-
137
-
138
-
139
-
140
-
141
-
142
-
143
-
144
-
145
-
146
-
147
-
148
-
149
-
150
-
151
-
152
-
153
-
154
-
155
-
156
-
157
-
158
-
159
-
160
-
161
-
162
-
163
-
164
-
165
-
166
-
167
-
168
-
169
-
170
-
171
-
172
-
173
-
174
-
175
-
176
-
177
-
178
-
179
-
180
-
181
-
182
-
183
-
184
-
185
-
186
-
187
-
188
-
189
-
190
-
191
-
192
-
193
-
194
-
195
-
196
-
197
-
198
-
199
-
200
-
201
-
202
-
203
-
204
-
205
-
206
-
207
-
208
 |
 |

Proxy Statement
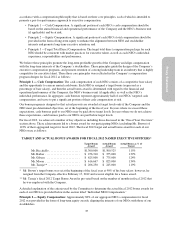
For fiscal 2012, the Committee generally targeted the 50th to 75th percentile of the market range of comparable
companies when setting the base salaries and target bonus opportunities for our NEOs, and targeted the 75th
percentile for our ongoing equity awards. While we generally target each component at these levels, the actual
base salary, bonus, and equity compensation provided to each NEO may be above or below these levels and is
determined based on the Company’s financial performance, each NEO’s business unit financial (if applicable),
strategic and operational performance, market trends, and other factors unique to each individual, such as their
role and experience.
The Committee also considers the aggregate value of all three total direct compensation components, and
generally targets the 50th to 75th percentile of the market range for ongoing total direct compensation. When
necessary for retention, succession planning, or recognition of outstanding performance, the Committee may
approve exceptional compensation programs for select key executives that could result in target total direct
compensation above our target range.
THE COMMITTEE’S PROCESS FOR DETERMINING AND REVIEWING NEO COMPENSATION
For fiscal 2012, the Committee reviewed and approved the total direct compensation of each of our NEOs (other
than for Mr. Riccitiello) in consultation with members of Company management and Compensia, which is the
independent compensation consulting firm retained by the Committee.
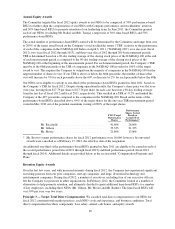
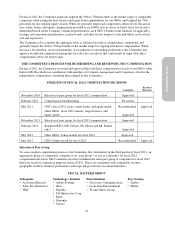
TIMELINE OF FISCAL 2012 COMPENSATION DECISIONS
Committee
Board of
Directors
November 2010 Selection of peer group for fiscal 2012 compensation Approved
February 2011 Compensation benchmarking Reviewed
May 2011 CEO’s fiscal 2012 salary, target bonus, and equity grants Recommended Approved
Other NEOs’ fiscal 2012 salaries, target bonuses, and
equity grants Approved
November 2011 Selection of peer group for fiscal 2013 compensation Approved
February 2012 Retention RSUs (Mr. Gibeau, Mr. Moore and Mr. Barker
only) Approved
May 2012 Other NEOs’ bonus awards for fiscal 2012 Approved
June 2012 CEO’s bonus award for fiscal 2012 Recommended Approved
Selection of Peer Group
To assess market compensation practices, the Committee first determined, in the third quarter of fiscal 2011, an
appropriate group of comparable companies (our “peer group”) to use as a reference for fiscal 2012
compensation decisions. The Committee elected to maintain the same peer group of companies for fiscal 2012
that were used for comparison purposes in fiscal 2011. These are companies with comparable revenue,
geographic markets, financial performance and expected growth rates in related industries.
FISCAL 2012 PEER GROUP
Videogame Technology / Internet Entertainment Toys /Games
• Activision Blizzard • Adobe Systems • Discovery Communications • Hasbro
• Take-Two Interactive • eBay • Lions Gate Entertainment • Mattel
• THQ • Expedia • Warner Music Group
• IAC/Interactive Corp.
• Intuit
• Symantec
• Yahoo!
37