Electronic Arts 2012 Annual Report Download - page 124
Download and view the complete annual report
Please find page 124 of the 2012 Electronic Arts annual report below. You can navigate through the pages in the report by either clicking on the pages listed below, or by using the keyword search tool below to find specific information within the annual report.-
 1
1 -
2
-
3
-
4
-
5
-
6
-
7
-
8
-
9
-
10
-
11
-
12
-
13
-
14
-
15
-
16
-
17
-
18
-
19
-
20
-
21
-
22
-
23
-
24
-
25
-
26
-
27
-
28
-
29
-
30
-
31
-
32
-
33
-
34
-
35
-
36
-
37
-
38
-
39
-
40
-
41
-
42
-
43
-
44
-
45
-
46
-
47
-
48
-
49
-
50
-
51
-
52
-
53
-
54
-
55
-
56
-
57
-
58
-
59
-
60
-
61
-
62
-
63
-
64
-
65
-
66
-
67
-
68
-
69
-
70
-
71
-
72
-
73
-
74
-
75
-
76
-
77
-
78
-
79
-
80
-
81
-
82
-
83
-
84
-
85
-
86
-
87
-
88
-
89
-
90
-
91
-
92
-
93
-
94
-
95
-
96
-
97
-
98
-
99
-
100
-
101
-
102
-
103
-
104
-
105
-
106
-
107
-
108
-
109
-
110
-
111
-
112
-
113
-
 114
114 -
 115
115 -
 116
116 -
 117
117 -
 118
118 -
 119
119 -
 120
120 -
 121
121 -
 122
122 -
 123
123 -
 124
124 -
 125
125 -
 126
126 -
 127
127 -
 128
128 -
 129
129 -
 130
130 -
 131
131 -
 132
132 -
 133
133 -
 134
134 -
135
-
136
-
137
-
138
-
139
-
140
-
141
-
142
-
143
-
144
-
145
-
146
-
147
-
148
-
149
-
150
-
151
-
152
-
153
-
154
-
155
-
156
-
157
-
158
-
159
-
160
-
161
-
162
-
163
-
164
-
165
-
166
-
167
-
168
-
169
-
170
-
171
-
172
-
173
-
174
-
175
-
176
-
177
-
178
-
179
-
180
-
181
-
182
-
183
-
184
-
185
-
186
-
187
-
188
-
189
-
190
-
191
-
192
-
193
-
194
-
195
-
196
-
197
-
198
-
199
-
200
-
201
-
202
-
203
-
204
-
205
-
206
-
207
-
208
 |
 |

Supplemental Net Revenue by Revenue Composition
As we continue to evolve our business and more of our products are delivered to consumers digitally via the
Internet, we place a greater emphasis and focus on assessing our business through a review of net revenue by
revenue composition.
Net Revenue before Revenue Deferral, a non-GAAP financial measure, is provided in this section of MD&A,
including a discussion of the components of this measure: (1) publishing and other, (2) wireless, Internet-derived,
and advertising (digital), and (3) distribution. See “Non-GAAP Financial Measures” below for an explanation of
our use of this non-GAAP financial measure. A reconciliation to the corresponding measure calculated in
accordance with U.S. GAAP is provided in the discussion below.
“Revenue Deferral” in this “Net Revenue” section includes the unrecognized revenue from (1) bundled sales of
software and software-related offerings for which we do not have VSOE for the software-related offerings,
(2) certain sales of MMO games, and (3) entitlements to content that are delivered through hosting services,
which are types of “micro-transactions.” Fluctuations in the Revenue Deferral are largely dependent upon the
amounts of products that we sell with the online features and services previously discussed, while the
Recognition of Revenue Deferral for a period is also dependent upon (1) the amount deferred, (2) the period of
time the software-related offerings are to be provided, and (3) the timing of the sale. For example, most Revenue
Deferrals incurred in the first half of a fiscal year are recognized within the same fiscal year; however,
substantially all of the Revenue Deferrals incurred in the last month of a fiscal year will be recognized in the
subsequent fiscal year.
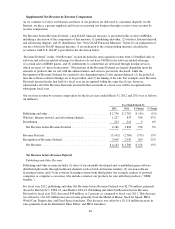
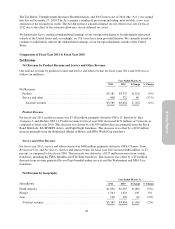
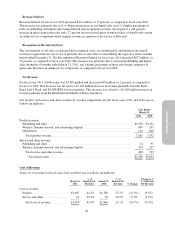
Our total net revenue by revenue composition for the fiscal years ended March 31, 2012 and 2011 was as follows
(in millions):
Year Ended March 31,
2012 2011 $ Change % Change
Publishing and other ........................................ $2,736 $ 2,781 $ (45) (2%)
Wireless, Internet-derived, and advertising (digital) ............... 1,227 833 394 47%
Distribution ............................................... 223 214 9 4%
Net Revenue before Revenue Deferral ........................ 4,186 3,828 358 9%
Revenue Deferral .......................................... (3,142) (2,769) (373) 13%
Recognition of Revenue Deferral .............................. 3,099 2,530 569 22%
Net Revenue ............................................ $4,143 $ 3,589 $ 554 15%
Net Revenue before Revenue Deferral
Publishing and Other Revenue
Publishing and other revenue includes (1) sales of our internally-developed and co-published game software
distributed physically through traditional channels such as brick and mortar retailers, (2) our non-software
licensing revenue, and (3) our software licensing revenue from third parties (for example, makers of personal
computers or computer accessories) who include certain of our products for sale with their products (“OEM
bundles”).
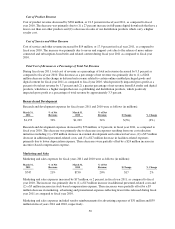
For fiscal year 2012, publishing and other Net Revenue before Revenue Deferral was $2,736 million, primarily
driven by Battlefield 3, FIFA 12, and Madden NFL 12. Publishing and other Net Revenue before Revenue
Deferral for fiscal year 2012 decreased $45 million, or 2 percent, as compared to fiscal year 2011. This decrease
was driven by a $1,163 million decrease in sales primarily from the Medal of Honor, Need for Speed, FIFA
World Cup, Dragon Age, and Dead Space franchises. This decrease was offset by a $1,118 million increase in
sales primarily from the Battlefield, Mass Effect, and FIFA franchises.
40