Electronic Arts 2012 Annual Report Download - page 129
Download and view the complete annual report
Please find page 129 of the 2012 Electronic Arts annual report below. You can navigate through the pages in the report by either clicking on the pages listed below, or by using the keyword search tool below to find specific information within the annual report.-
 1
1 -
2
-
3
-
4
-
5
-
6
-
7
-
8
-
9
-
10
-
11
-
12
-
13
-
14
-
15
-
16
-
17
-
18
-
19
-
20
-
21
-
22
-
23
-
24
-
25
-
26
-
27
-
28
-
29
-
30
-
31
-
32
-
33
-
34
-
35
-
36
-
37
-
38
-
39
-
40
-
41
-
42
-
43
-
44
-
45
-
46
-
47
-
48
-
49
-
50
-
51
-
52
-
53
-
54
-
55
-
56
-
57
-
58
-
59
-
60
-
61
-
62
-
63
-
64
-
65
-
66
-
67
-
68
-
69
-
70
-
71
-
72
-
73
-
74
-
75
-
76
-
77
-
78
-
79
-
80
-
81
-
82
-
83
-
84
-
85
-
86
-
87
-
88
-
89
-
90
-
91
-
92
-
93
-
94
-
95
-
96
-
97
-
98
-
99
-
100
-
101
-
102
-
103
-
104
-
105
-
106
-
107
-
108
-
109
-
110
-
111
-
112
-
113
-
114
-
115
-
116
-
117
-
118
-
 119
119 -
 120
120 -
 121
121 -
 122
122 -
 123
123 -
 124
124 -
 125
125 -
 126
126 -
 127
127 -
 128
128 -
 129
129 -
 130
130 -
 131
131 -
 132
132 -
 133
133 -
 134
134 -
 135
135 -
 136
136 -
 137
137 -
 138
138 -
 139
139 -
140
-
141
-
142
-
143
-
144
-
145
-
146
-
147
-
148
-
149
-
150
-
151
-
152
-
153
-
154
-
155
-
156
-
157
-
158
-
159
-
160
-
161
-
162
-
163
-
164
-
165
-
166
-
167
-
168
-
169
-
170
-
171
-
172
-
173
-
174
-
175
-
176
-
177
-
178
-
179
-
180
-
181
-
182
-
183
-
184
-
185
-
186
-
187
-
188
-
189
-
190
-
191
-
192
-
193
-
194
-
195
-
196
-
197
-
198
-
199
-
200
-
201
-
202
-
203
-
204
-
205
-
206
-
207
-
208
 |
 |

Annual Report
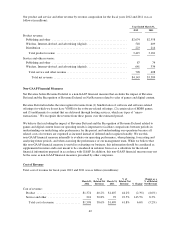
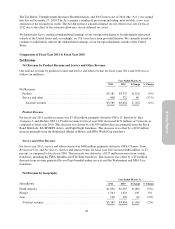
connection with our Playfish acquisition resulting from revisions in our estimate of the expected future cash
flows over the period in which the obligation was expected to be settled with no comparable revision to decrease
the accrual in fiscal year 2012 and (2) a contributing increase of $9 million resulting from contingent
consideration from other acquisitions in the current year.
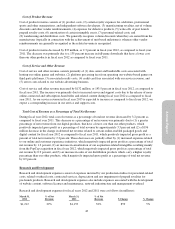
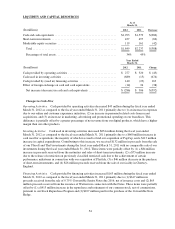
Amortization of Intangibles
Amortization of intangibles for fiscal years 2012 and 2011 were as follows (in millions):
March 31,
2012
% of Net
Revenue
March 31,
2011
% of Net
Revenue $ Change % Change
$43 1% $57 2% $(14) (25%)
Amortization of intangibles decreased by $14 million, or 25 percent, in fiscal year 2012, as compared to fiscal
year 2011. This decrease was primarily due to certain intangible assets from our prior year acquisitions being
fully amortized during the fiscal year 2012.
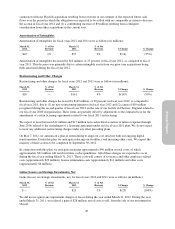
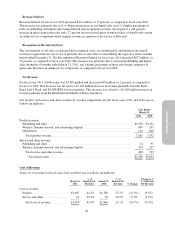
Restructuring and Other Charges
Restructuring and other charges for fiscal years 2012 and 2011 were as follows (in millions):
March 31,
2012
% of Net
Revenue
March 31,
2011
% of Net
Revenue $ Change % Change
$16 — $161 4% $(145) (90%)
Restructuring and other charges decreased by $145 million, or 90 percent, in fiscal year 2012, as compared to
fiscal year 2011, due to (1) no new restructuring initiatives in fiscal year 2012 and (2) a gain of $10 million
recognized during the second quarter of fiscal year 2012 on the sale of our facility in Chertsey, England related to
our fiscal year 2008 reorganization. These items are partially offset by adjustments to the estimated loss for the
amendment of certain licensing agreements related to our fiscal 2011 restructuring.
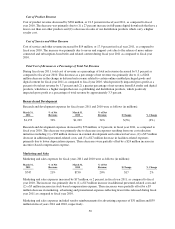
We expect to incur between $12 million and $17 million non-cash related accretion of interest expense through
June 2016, related to the amendment of a licensing agreement under our fiscal year 2011 plan. We do not expect
to incur any additional restructuring charges under any other preceding plans.
On May 7, 2012, we announced a plan of restructuring to align our cost structure with our ongoing digital
transformation. Under this plan, we anticipate reducing our workforce and incurring other costs. We expect the
majority of these actions to be completed by September 30, 2012.
In connection with this plan, we anticipate incurring approximately $40 million in total costs, of which
approximately $31 million will result in future cash expenditures. All of these charges are expected to occur
during the fiscal year ending March 31, 2013. These costs will consist of severance and other employee-related
costs (approximately $23 million), license termination costs (approximately $11 million) and other costs
(approximately $6 million).
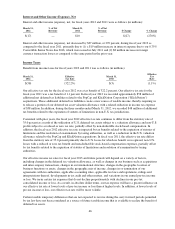
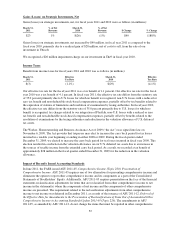
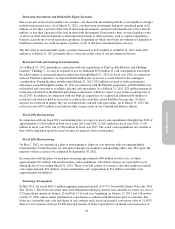
Gains (Losses) on Strategic Investments, Net
Gains (losses) on strategic investments, net, for fiscal years 2012 and 2011 were as follows (in millions):
March 31,
2012
% of Net
Revenue
March 31,
2011
% of Net
Revenue $ Change % Change
$ — — $23 1% $(23) (100%)
We did not recognize any impairment charges or losses during the year ended March 31, 2012. During the year
ended March 31, 2011, we realized a gain of $28 million, net of costs to sell, from the sale of our investment in
Ubisoft.
45