Electronic Arts 2012 Annual Report Download - page 112
Download and view the complete annual report
Please find page 112 of the 2012 Electronic Arts annual report below. You can navigate through the pages in the report by either clicking on the pages listed below, or by using the keyword search tool below to find specific information within the annual report.-
 1
1 -
2
-
3
-
4
-
5
-
6
-
7
-
8
-
9
-
10
-
11
-
12
-
13
-
14
-
15
-
16
-
17
-
18
-
19
-
20
-
21
-
22
-
23
-
24
-
25
-
26
-
27
-
28
-
29
-
30
-
31
-
32
-
33
-
34
-
35
-
36
-
37
-
38
-
39
-
40
-
41
-
42
-
43
-
44
-
45
-
46
-
47
-
48
-
49
-
50
-
51
-
52
-
53
-
54
-
55
-
56
-
57
-
58
-
59
-
60
-
61
-
62
-
63
-
64
-
65
-
66
-
67
-
68
-
69
-
70
-
71
-
72
-
73
-
74
-
75
-
76
-
77
-
78
-
79
-
80
-
81
-
82
-
83
-
84
-
85
-
86
-
87
-
88
-
89
-
90
-
91
-
92
-
93
-
94
-
95
-
96
-
97
-
98
-
99
-
100
-
101
-
 102
102 -
 103
103 -
 104
104 -
 105
105 -
 106
106 -
 107
107 -
 108
108 -
 109
109 -
 110
110 -
 111
111 -
 112
112 -
 113
113 -
 114
114 -
 115
115 -
 116
116 -
 117
117 -
 118
118 -
 119
119 -
 120
120 -
 121
121 -
 122
122 -
123
-
124
-
125
-
126
-
127
-
128
-
129
-
130
-
131
-
132
-
133
-
134
-
135
-
136
-
137
-
138
-
139
-
140
-
141
-
142
-
143
-
144
-
145
-
146
-
147
-
148
-
149
-
150
-
151
-
152
-
153
-
154
-
155
-
156
-
157
-
158
-
159
-
160
-
161
-
162
-
163
-
164
-
165
-
166
-
167
-
168
-
169
-
170
-
171
-
172
-
173
-
174
-
175
-
176
-
177
-
178
-
179
-
180
-
181
-
182
-
183
-
184
-
185
-
186
-
187
-
188
-
189
-
190
-
191
-
192
-
193
-
194
-
195
-
196
-
197
-
198
-
199
-
200
-
201
-
202
-
203
-
204
-
205
-
206
-
207
-
208
 |
 |

Item 6: Selected Financial Data
ELECTRONIC ARTS INC. AND SUBSIDIARIES
SELECTED FIVE-YEAR CONSOLIDATED FINANCIAL DATA
(In millions, except per share data)
Year Ended March 31,
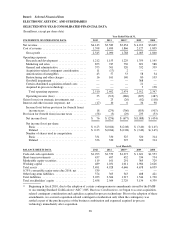
STATEMENTS OF OPERATIONS DATA 2012 2011 2010(a) 2009 2008
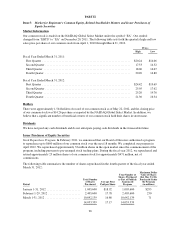
Net revenue ................................. $4,143 $3,589 $3,654 $ 4,212 $3,665
Cost of revenue .............................. 1,598 1,499 1,866 2,127 1,805
Gross profit ............................... 2,545 2,090 1,788 2,085 1,860
Operating expenses:
Research and development ................... 1,212 1,153 1,229 1,359 1,145
Marketing and sales ........................ 853 747 730 691 588
General and administrative ................... 375 301 320 332 339
Acquisition-related contingent consideration ..... 11 (17) 2 — —
Amortization of intangibles .................. 43 57 53 58 34
Restructuring and other charges ............... 16 161 140 80 103
Goodwill impairment ....................... — — — 368 —
Certain abandoned acquisition-related costs ..... — — — 21 —
Acquired in-process technology ............... — — — 3 138
Total operating expenses .................. 2,510 2,402 2,474 2,912 2,347
Operating income (loss) ..................... 35 (312) (686) (827) (487)
Gains (losses) on strategic investments, net ........ — 23 (26) (62) (118)
Interest and other income (expense), net .......... (17) 10 6 34 98
Income (loss) before provision for (benefit from)
income taxes ............................ 18 (279) (706) (855) (507)
Provision for (benefit from) income taxes ......... (58) (3) (29) 233 (53)
Net income (loss) .......................... $ 76 $ (276) $ (677) $(1,088) $ (454)
Net income (loss) per share:
Basic .................................. $ 0.23 $ (0.84) $ (2.08) $ (3.40) $ (1.45)
Diluted ................................ $ 0.23 $ (0.84) $ (2.08) $ (3.40) $ (1.45)
Number of shares used in computation:
Basic .................................. 331 330 325 320 314
Diluted ................................ 336 330 325 320 314
As of March 31,
BALANCE SHEETS DATA 2012 2011 2010(a) 2009 2008
Cash and cash equivalents ..................... $1,293 $1,579 $1,273 $ 1,621 $1,553
Short-term investments ........................ 437 497 432 534 734
Marketable equity securities .................... 119 161 291 365 729
Working capital .............................. 489 1,031 1,011 1,984 2,626
Total assets ................................. 5,491 4,928 4,646 4,678 6,059
0.75% convertible senior notes due 2016, net ...... 539 — — — —
Other long-term liabilities ...................... 374 363 343 408 421
Total liabilities .............................. 3,033 2,364 1,917 1,544 1,720
Total stockholders’ equity ..................... 2,458 2,564 2,729 3,134 4,339
(a) Beginning in fiscal 2010, due to the adoption of certain contemporaneous amendments issued by the FASB
to Accounting Standard Codification (“ASC”) 805, Business Combinations, we began to accrue acquisition-
related contingent consideration and capitalize acquired in-process technology. Prior to the adoption of these
amendments, we accrued acquisition-related contingent consideration only when the contingency was
settled as part of the purchase price of the business combination and expensed acquired in-process
technology immediately after acquisition.
28